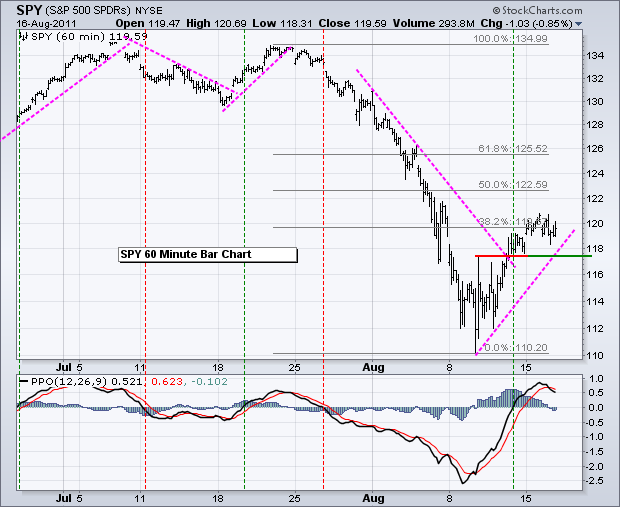
Stocks are caught between a rock (medium-term downtrend) and a hard place (short-term uptrend). After a good bounce the last few days, stocks took a breather with some weakness on Tuesday. Actually, stocks have been trading flat since Monday's gap up. This sideways action could be just a consolidation within a short-term uptrend. On the SPY chart, the ETF moved above 120 early Monday and then oscillated around this level. I give the bulls the short-term edge as long as support holds. The 50% retracement marks the next upside target in the 122.59 area. The resistance break and pink trendline mark first support at 117.50. A break below this level would provide the first sign of short-term weakness. Momentum-wise, the Percent Price Oscillator (PPO) rolled over and broke its signal line. Even so, I consider short-term momentum bullish as long as PPO remains positive. The green and red dotted lines show the positive/negative crosses in PPO. A support break in the ETF and negative cross in PPO would be enough to turn short-term bearish again.
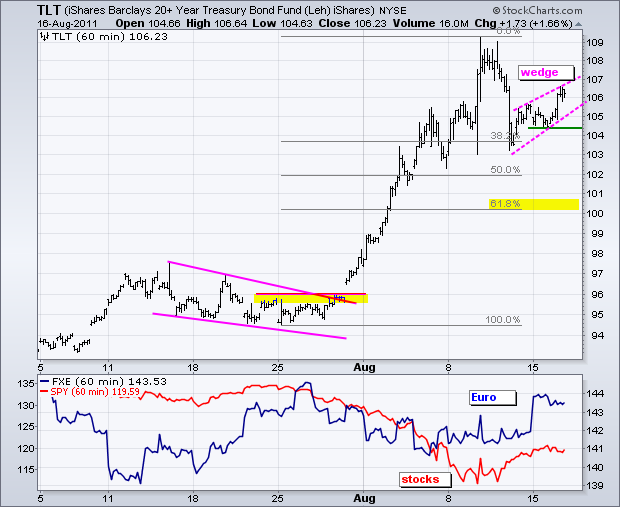
The 20+ year Bond ETF (TLT) rebounded on Tuesday as money moved out of stocks and the Euro. Never mind the Fed, these two provide the biggest influence on bonds. Bonds surged as the Euro and stock market declined in early August. Bonds weakened as the Euro and stock market bounced recently. Keep an eye on these two for extra clues on bonds. On the price chart, TLT formed a rising wedge with Monday's low marking support. A break below this level would reverse the rise and signal a continuation of last week's decline.
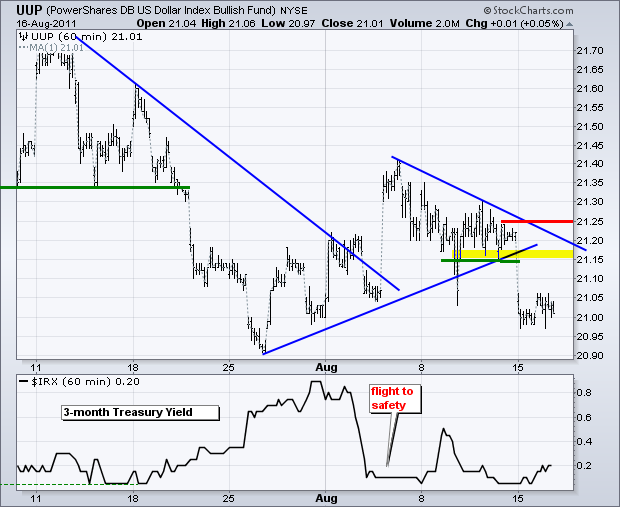
The US Dollar Fund (UUP) broke down on Monday and stayed down on Tuesday. While this breakdown is clearly bearish, the tide could easily turn against the Euro and traders need to be vigilant here. In fact, I would not be surprised to see directionless trading in UUP as the market fixation bounces from Dollar negatives to Euro negatives. The trendline extending down from early August and the prior consolidation mark a resistance zone. I am setting key resistance at 21.25. A break above this level would reverse the current downtrend in UUP.
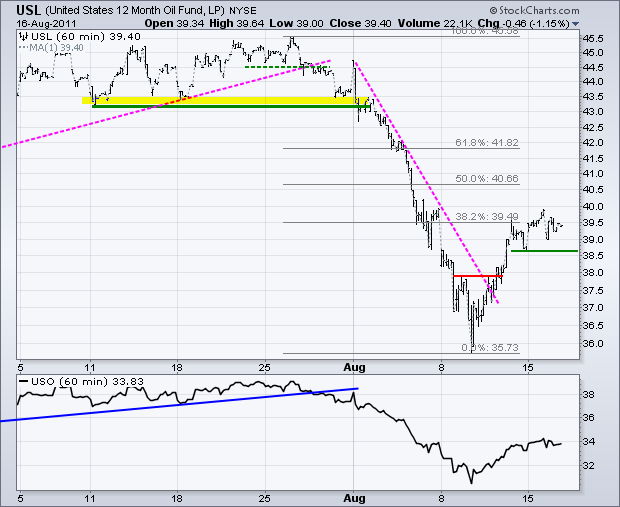
The 12-Month US Oil Fund (USL) moved higher with the stock market and weakened with the stock market on Tuesday. The short-term trend is clearly up right now. USL is stalling near the 38.2% retracement with first support at 38.50. A break below this level would argue for a trend reversal and a test of last week's low.
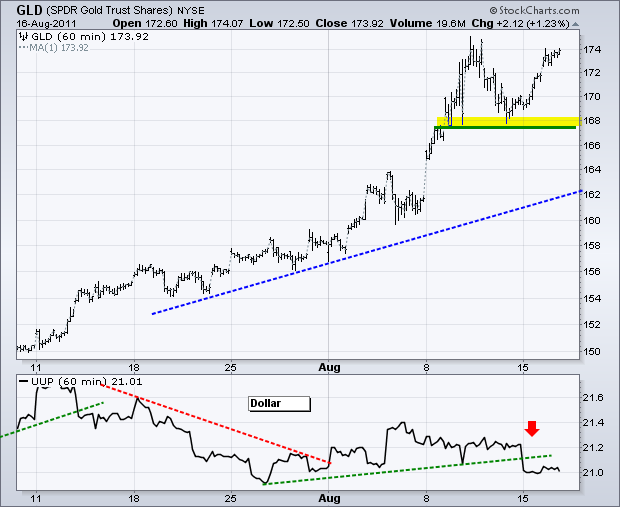
The Gold SPDR (GLD) bounced off support Friday and kept on rising Monday-Tuesday. Betting on a sustained decline in gold is futile in this strong uptrend. With this bounce, last week's low marks key support in the 168 area. A move below this low would reverse the short-term uptrend and argue for a deeper pullback.
Key Economic Reports:
Wed - Aug 17 - 07:00 - MBA Mortgage Index
Wed - Aug 17 - 08:30 - PPI
Wed - Aug 17 - 10:30 - Crude Inventories
Thu - Aug 18 - 08:30 - Initial Claims
Thu - Aug 18 - 08:30 - CPI
Thu - Aug 18 - 10:00 - Existing Home Sales
Thu - Aug 18 - 10:00 - Philadelphia Fed
Thu - Aug 18 - 10:00 - Leading Indicators
Charts of Interest: Tuesday and Thursday in separate post.
This commentary and charts-of-interest are designed to stimulate thinking. This analysis is not a recommendation to buy, sell, hold or sell short any security (stock ETF or otherwise). We all need to think for ourselves when it comes to trading our own accounts. First, it is the only way to really learn. Second, we are the only ones responsible for our decisions. Think of these charts as food for further analysis. Before making a trade, it is important to have a plan. Plan the trade and trade the plan. Among other things, this includes setting a trigger level, a target area and a stop-loss level. It is also important to plan for three possible price movements: advance, decline or sideways. Have a plan for all three scenarios BEFORE making the trade. Consider possible holding times. And finally, look at overall market conditions and sector/industry performance.

