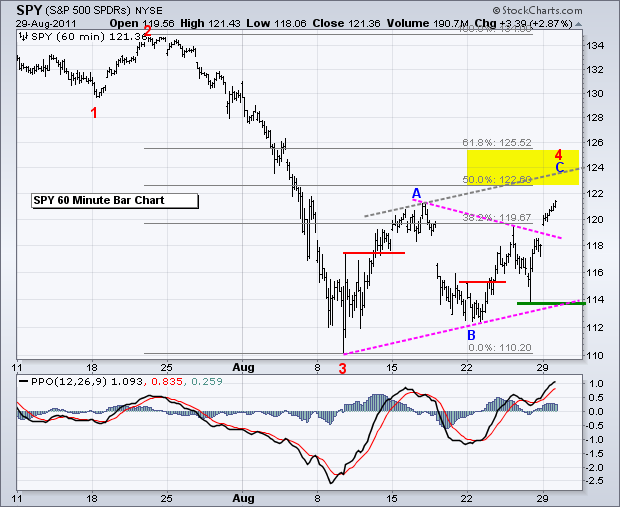
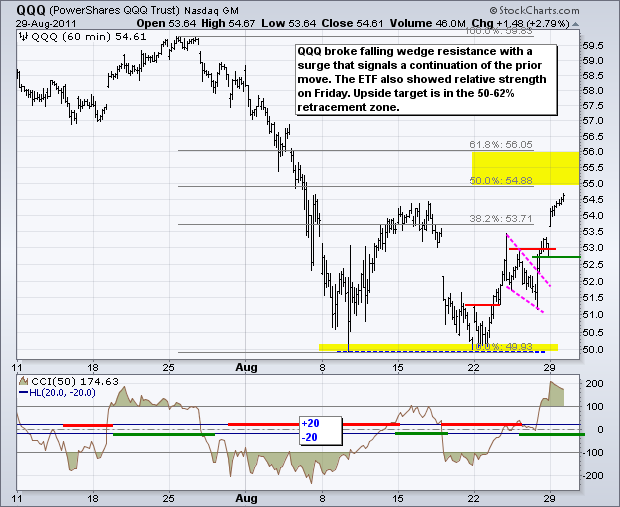
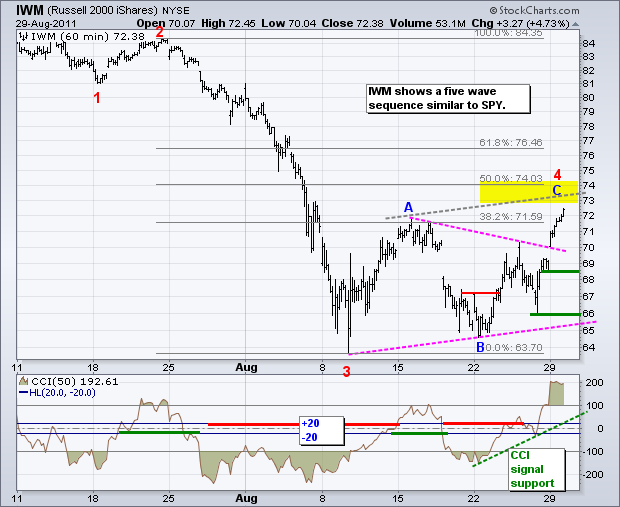
Stocks continued higher on Monday with another all or nothing day. Net Advancing Volume for the NYSE and Nasdaq hit +94% and +93%, respectively. All major index ETFs were sharply higher with small-caps and mid-caps leading the way. All sectors were also higher with finance leading the charge. It appears that Wall Street does not want to get caught flat-footed ahead of a big economic week. Wednesday and Thursday are the big days. The ADP Employment Report, Chicago PMI and Factory Orders are due Wednesday, while the ISM Index, Jobless Claims and Auto-Truck Sales are due Thursday. These two days will shed more light on the recent "past". At this point, stocks are already pricing in better news. SPY is up 7.66% in the last six days, QQQ is up 8.76% and IWM is up a whopping 11.27%. There is little room for disappointment now. On the price chart, SPY is in the midst of a fourth wave corrective advance. This pattern looks like an ABC zigzag with a target zone around 123-125. The gray trendline, which is parallel to the lower trendline of the triangle, extends to the 124 area. The 50-61.80% retracement zone also marks resistance here. Monday's gap and triangle break mark the first support zone. A move below 118 would negate these signals and suggest that wave 4 has ended. A Percent Price Oscillator (PPO) move into negative territory would confirm.
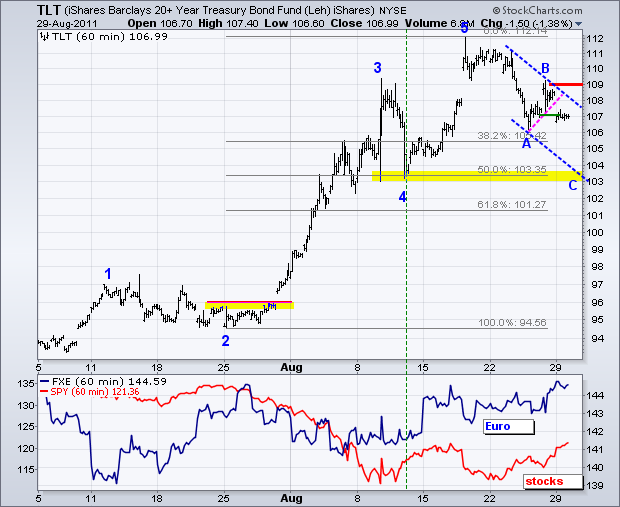
Five wave sequences are popping up all over the place. The 20+ year Bond ETF (TLT) traced out a five wave advance from the early July low to the August high. This suggests that a corrective move is in order now, such as an ABC zigzag lower. This also fits with SPY and its ABC zigzag higher. With Monday's decline and short-term support break, I am now marking resistance at 109.
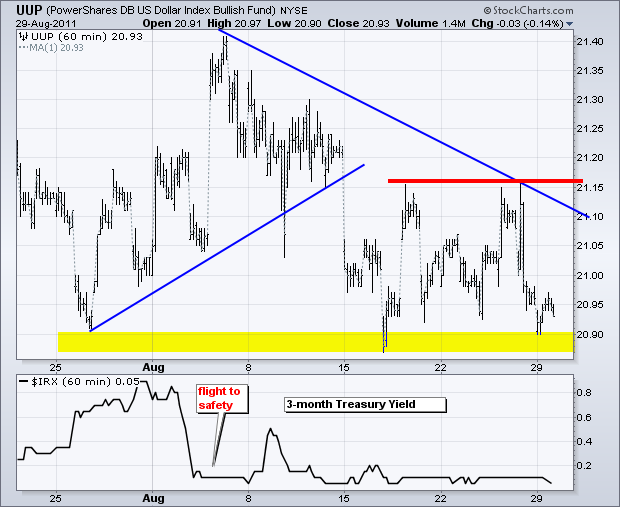
The US Dollar Fund (UUP) remains in a choppy downtrend as it trades near support in the 20.90 area. The Euro Currency Trust (FXE) cannot break resistance and the US Dollar Fund (UUP) cannot break support. Nobody wants to hold either currency for an extended length of time. There is a pretty clear resistance zone around 21.15 from the highs of the last two weeks. Look for a break above this level to show some confidence in the greenback and doubts on the Euro. The Euro is under pressure this morning because the ECB may have to abandon its hawkish stance due to inflationary and economic pressures.
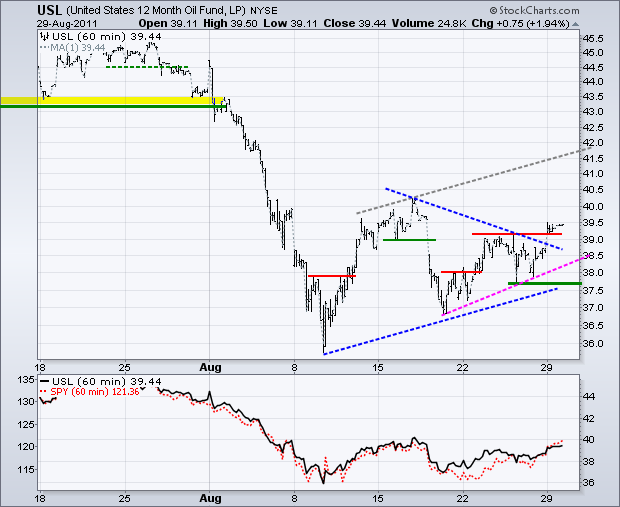
The 12-Month US Oil Fund (USL) broke out of its triangle, just like SPY. Oil has been trending higher since mid August, but the move looks pretty tepid. Nevertheless, the trend is up as long as support in the 37.7 area holds.
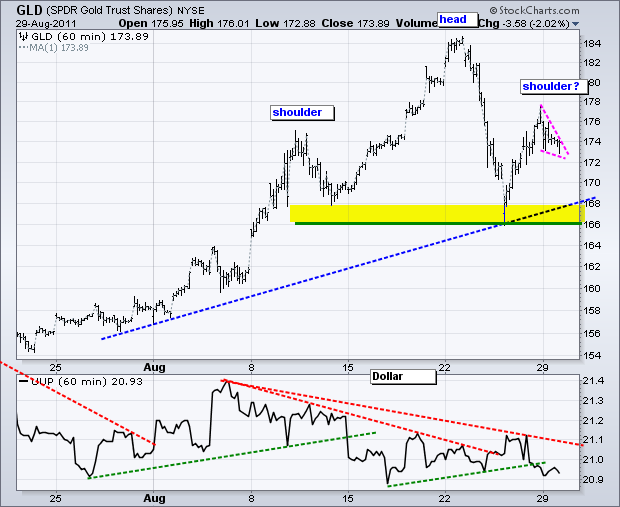
There are two visible patterns working for the Gold SPDR (GLD). First, a Head-and-Shoulders could be taking shape the last three weeks. This is quite premature, but the ETF is hitting resistance near the left shoulder high. I would also not be surprised to see another support test given last week's sharp decline. The second pattern is a falling wedge, which is potentially bullish. A break above 175 would signal a continuation higher.
It is still a HUGE week for economic reports. Traders will get a real feel for the economy with the Chicago PMI, Factory Orders and the ISM Index. Weak reports in early July and August weighed on the market. September is the chance for redemption or confirmation. The week ends with the Employment Report on Friday.
Key Economic Reports:
Tue - Aug 30 - 09:00 - Case-Shiller Housing Index
Tue - Aug 30 - 10:00 - Consumer Confidence
Wed - Aug 31 - 07:30 - Challenger Job Cuts
Wed - Aug 31 - 08:15 - ADP Employment
Wed - Aug 31 - 09:45 - Chicago PMI
Wed - Aug 31 - 10:00 - Factory Orders
Wed - Aug 31 - 10:30 - Oil Inventories
Thu - Sep 01 - 08:30 - Jobless Claims
Thu - Sep 01 - 10:00 - ISM Index
Thu - Sep 01 - 10:00 - Construction Spending
Thu - Sep 01 - 15:00 - Auto-Truck Sales
Fri - Sep 02 - 08:30 - Employment Report - Nonfarm Payrolls
Charts of Interest: Tuesday and Thursday in separate post.
This commentary and charts-of-interest are designed to stimulate thinking. This analysis is not a recommendation to buy, sell, hold or sell short any security (stock ETF or otherwise). We all need to think for ourselves when it comes to trading our own accounts. First, it is the only way to really learn. Second, we are the only ones responsible for our decisions. Think of these charts as food for further analysis. Before making a trade, it is important to have a plan. Plan the trade and trade the plan. Among other things, this includes setting a trigger level, a target area and a stop-loss level. It is also important to plan for three possible price movements: advance, decline or sideways. Have a plan for all three scenarios BEFORE making the trade. Consider possible holding times. And finally, look at overall market conditions and sector/industry performance.

