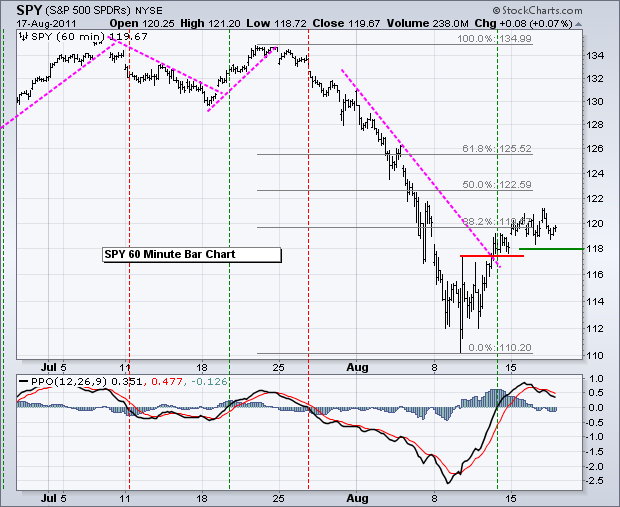
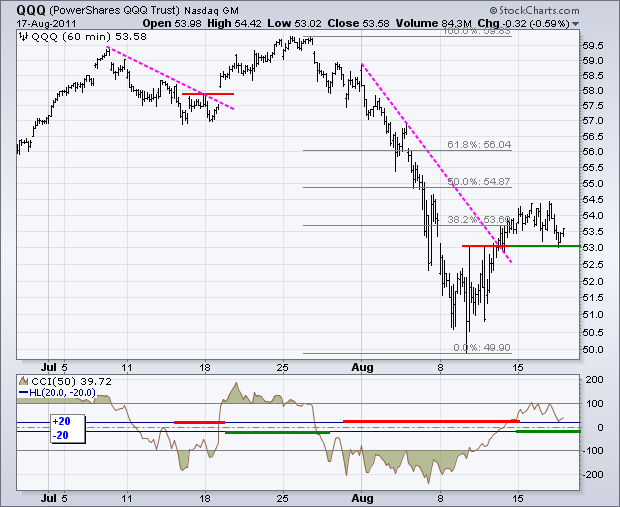
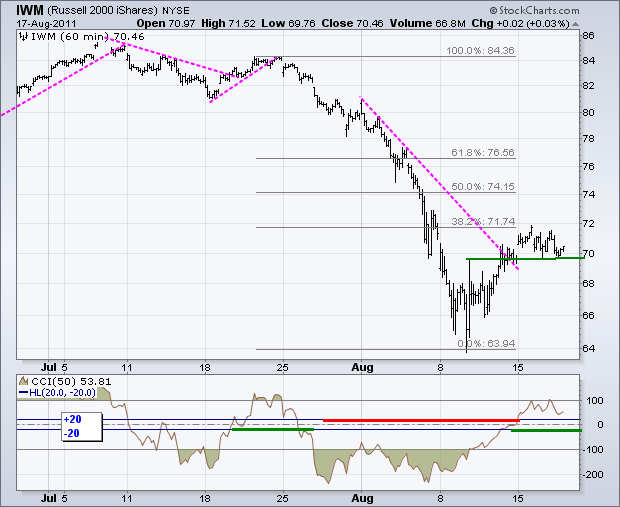
The 38.2% retracements are marking resistance as the major index ETFs stutter this week. From low to high, the S&P 500 ETF (SPY) surged from 110 to 121 over the past week. Most of this move came with Thursday's surge from 113 to 119. Trading since this surge has been rather choppy as indecision took over. Indecision means that selling pressure equaled buying pressure and price action was flat. This is as good a spot as any for a short-term peak that could give way to a retest of the August lows. I am marking support at 118 for SPY. The Percent Price Oscillator (PPO) marks momentum support at the zero line. A move below these levels would turn the short-term trend down for SPY. As noted in yesterday's market message, the current advance looks like Wave 4 of a five wave decline. Forth waves are corrective and not much is expected on the upside. Before getting too bearish on stocks, don't forget that the Fed has its annual meeting in Jackson Hole (Wyoming) next week (25-27 Aug). This could provide some sparks for the market, provided the Fed has a silver bullet or two left.
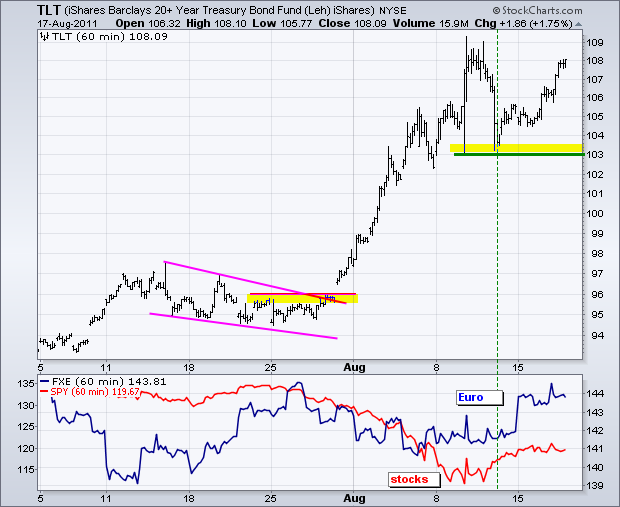
Strength in safe-haven Treasuries is a potential negative for the stock market and the Euro. With stocks holding their gains from last week and the Euro moving higher, I expected Treasuries to weaken or remain near support. Instead, the 20+ year Bond ETF (TLT) hit support in the 103 area and surged back towards last week's highs. The move reinforces support in the 103 area. Moreover, strength in Treasuries indicates that the demand for a safe-haven remains strong. Treasuries could also be moving higher in anticipation of the Fed meeting in Jackson Hold (25-27 August). Rumors are that some sort of QE3 will come out of this meeting. Moreover, the Fed could extend Treasury purchases to the long end of the curve (20-30 year).
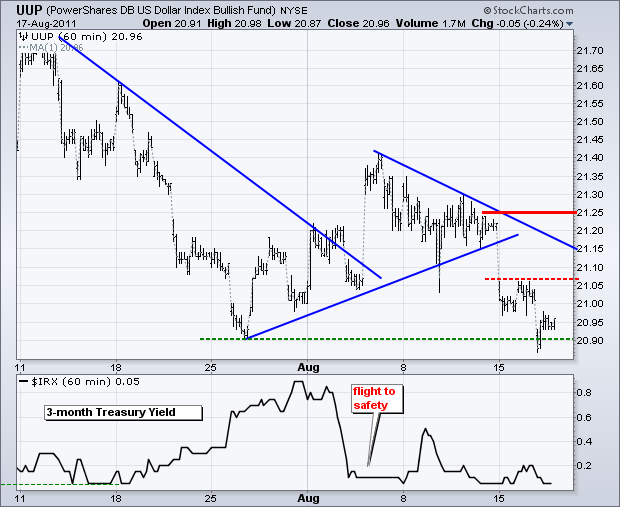
Strength in Treasuries could be hinting at a return to the risk-off trade, which would be Dollar bullish and equity bearish. The US Dollar Fund (UUP) broke down on Monday and moved to the late July lows this week. There is potential support here, but we have yet to see a bounce. I am marking first resistance at 21.07. A move above this level would be for the bottom pickers bounce. Key resistance remains at 21.25. A move above this level would break the early August trendline and fully reverse the short-term downtrend.
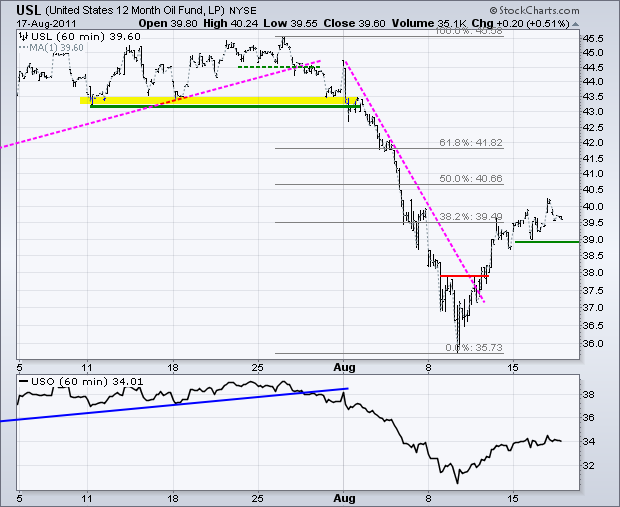
The 12-Month US Oil Fund (USL) surged to the 38.2% retracement last week and edged higher over the last three days. The rally in oil has been held in check by indecision in the stock market. I am setting support at 30. A break below this level would argue for a trend reversal and test of last week's low.
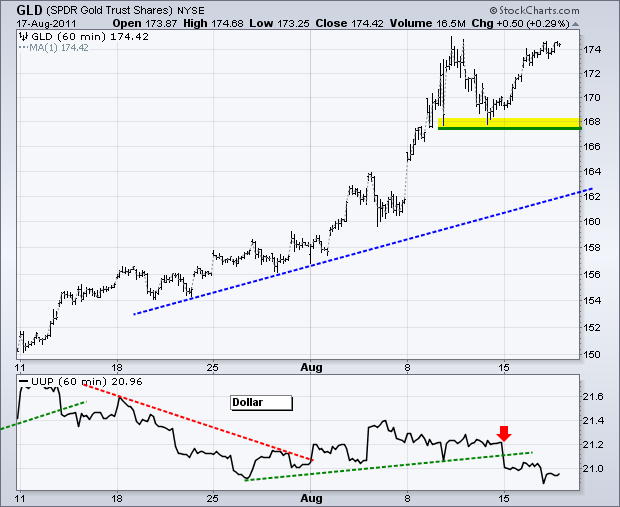
There is no change in the Gold SPDR (GLD). The ETF bounced off support in the 168 area to challenge last week's highs. The trend is nothing but up here.
Key Economic Reports:
Wed - Aug 17 - 07:00 - MBA Mortgage Index
Wed - Aug 17 - 08:30 - PPI
Wed - Aug 17 - 10:30 - Crude Inventories
Thu - Aug 18 - 08:30 - Initial Claims
Thu - Aug 18 - 08:30 - CPI
Thu - Aug 18 - 10:00 - Existing Home Sales
Thu - Aug 18 - 10:00 - Philadelphia Fed
Thu - Aug 18 - 10:00 - Leading Indicators
Charts of Interest: Tuesday and Thursday in separate post.
This commentary and charts-of-interest are designed to stimulate thinking. This analysis is not a recommendation to buy, sell, hold or sell short any security (stock ETF or otherwise). We all need to think for ourselves when it comes to trading our own accounts. First, it is the only way to really learn. Second, we are the only ones responsible for our decisions. Think of these charts as food for further analysis. Before making a trade, it is important to have a plan. Plan the trade and trade the plan. Among other things, this includes setting a trigger level, a target area and a stop-loss level. It is also important to plan for three possible price movements: advance, decline or sideways. Have a plan for all three scenarios BEFORE making the trade. Consider possible holding times. And finally, look at overall market conditions and sector/industry performance.

