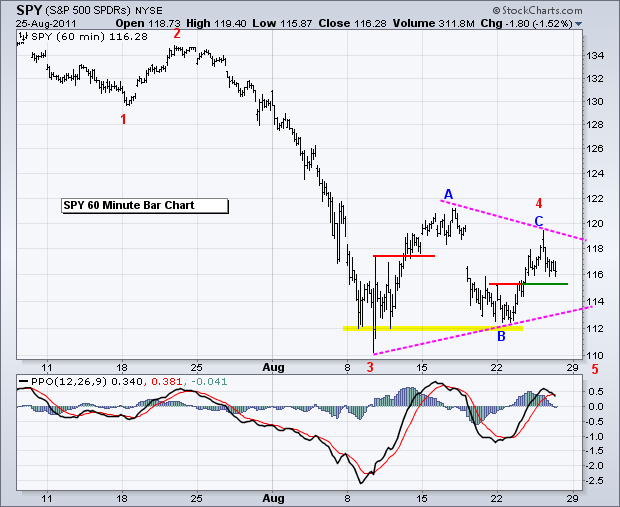
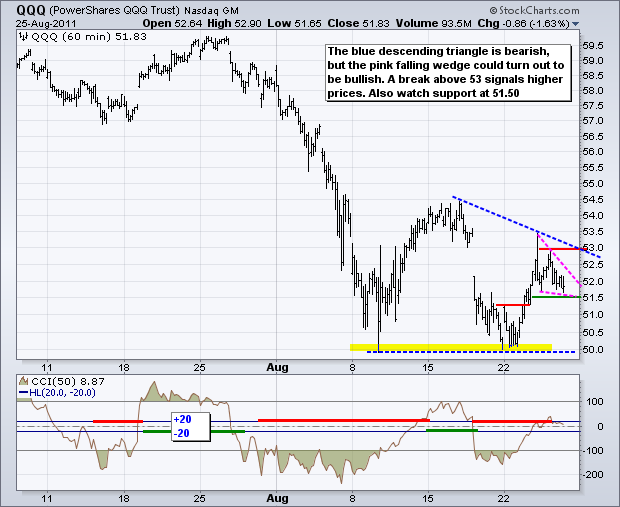
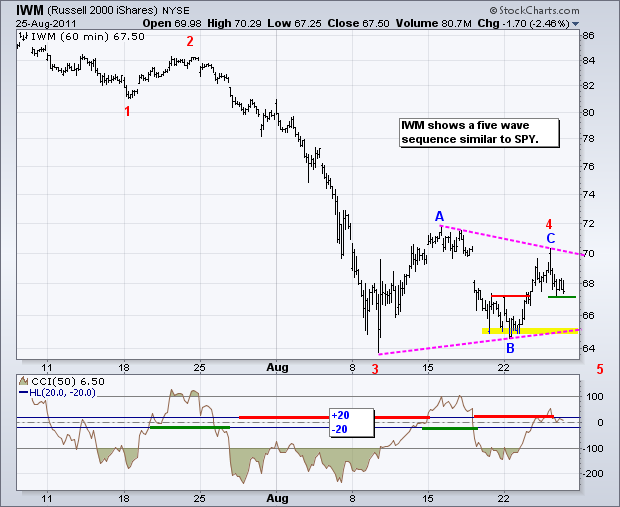
Stocks opened strong on the heels of Warren Buffet's $5 billion investment in Bank of America (BAC). However, stocks did not finish strong. Neither did BAC or the other big banks. Selling pressure took hold after this strong open and stocks closed down. The major index ETFs lost 1.5% or more with small-caps leading the way lower. All sectors were down with energy and consumer discretionary leading downward. Relative weakness in small-caps and the consumer discretionary sector is not a good sign. Also note that the Finance SPDR (XLF) closed down after being up 4.9% in early trading. Zero follow-through and a weak close shows little confidence in Buffet's high profile investment. On the price chart, SPY peaked just below 120 and it is now possible to draw a trendline extending down from the mid August high. Overall, a triangle is taking shape with support at 112. Also note that a clear five wave sequence is underway. Fourth waves tend to be flat and this is clearly an ABC flat. We could see this triangle extend with waves D and E before getting a continuation lower. At this point, the market's reaction to Bernanke's speech will dictate the next signal.
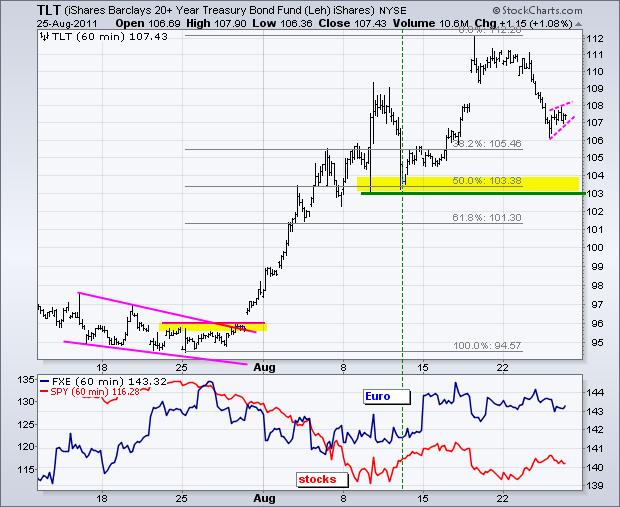
The 20+ year Bond ETF (TLT) remains in a long-term uptrend, but could be poised for another short-term move lower as a pennant/wedge formed on Thursday. The sharp decline from 111 to 106 created short-term oversold conditions. This pennant/wedge alleviates this condition. A move below the lower trendline would signal a continuation lower with a target to the next support zone around 103-104.
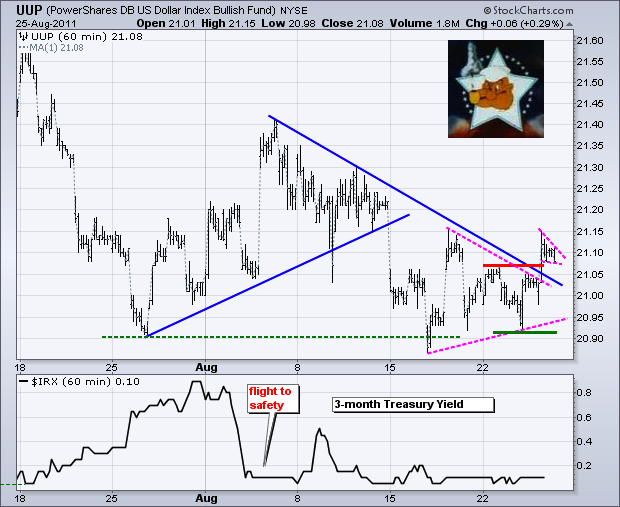
Well blow me down (Popeye, 1930). The US Dollar Fund (UUP) broke out of its triangle consolidation with a move above 21.10 on Thursday. But will it hold? UUP surged in the first hour and then stalled with a falling pennant/wedge. A break above the upper trendline would signal a continuation higher and reinforce the breakout. The Dollar is lower in overnight trading, but today's move will depend on the reaction to Bernanke's speech.
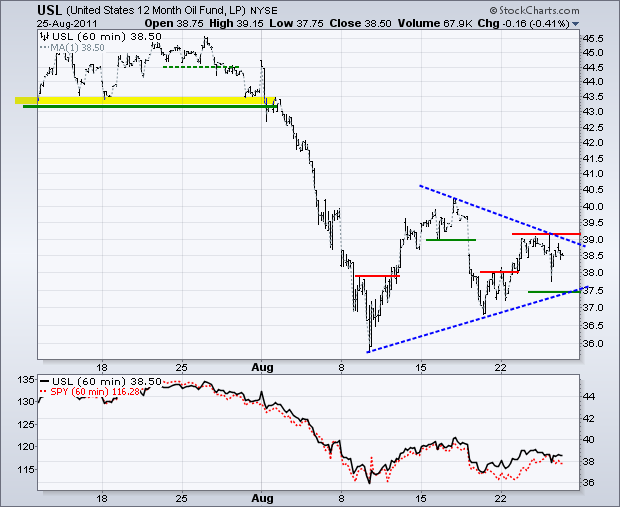
The 12-Month US Oil Fund (USL) also has a triangle working over the last few weeks. The ETF dipped below 38 for a few minutes on Thursday, but quickly recovered and continued to firm. A move above this week's high would break triangle resistance and open the door to the low 40s. Triangle support is set at 37.50 and a break below this level would target new lows.
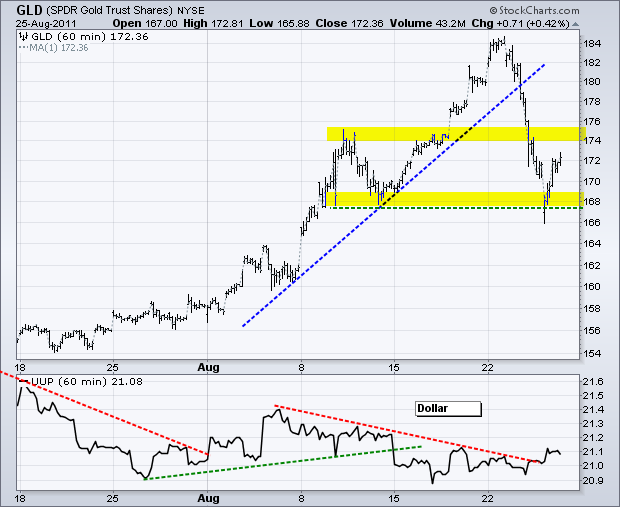
The Gold SPDR (GLD) finally hit a support level in the 168 area. The ETF opened below 168, but recovered in the first hour and worked its way higher the rest of the day. We could see resistance in the 174-175 area again. This level marked resistance the second week of August.
Key Economic Reports:
Fri - Aug 26 - 08:30 - GDP
Fri - Aug 26 - 09:55 - Michigan Sentiment
Fri - Aug 26 – 10:00 – Bernanke Speaks from Jackson Hole
Charts of Interest: Tuesday and Thursday in separate post.
This commentary and charts-of-interest are designed to stimulate thinking. This analysis is not a recommendation to buy, sell, hold or sell short any security (stock ETF or otherwise). We all need to think for ourselves when it comes to trading our own accounts. First, it is the only way to really learn. Second, we are the only ones responsible for our decisions. Think of these charts as food for further analysis. Before making a trade, it is important to have a plan. Plan the trade and trade the plan. Among other things, this includes setting a trigger level, a target area and a stop-loss level. It is also important to plan for three possible price movements: advance, decline or sideways. Have a plan for all three scenarios BEFORE making the trade. Consider possible holding times. And finally, look at overall market conditions and sector/industry performance.

