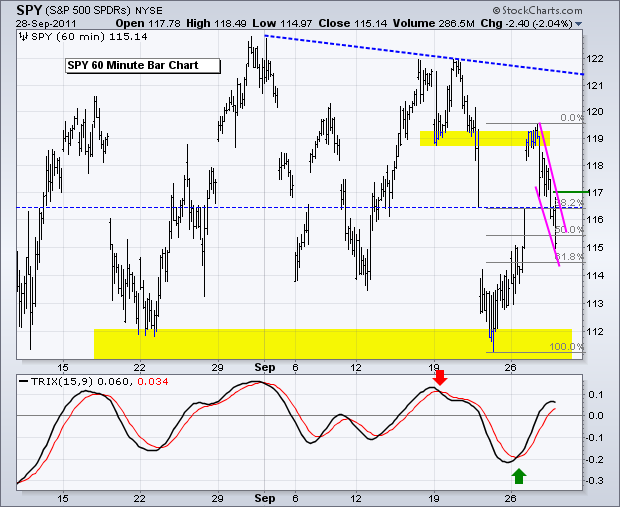
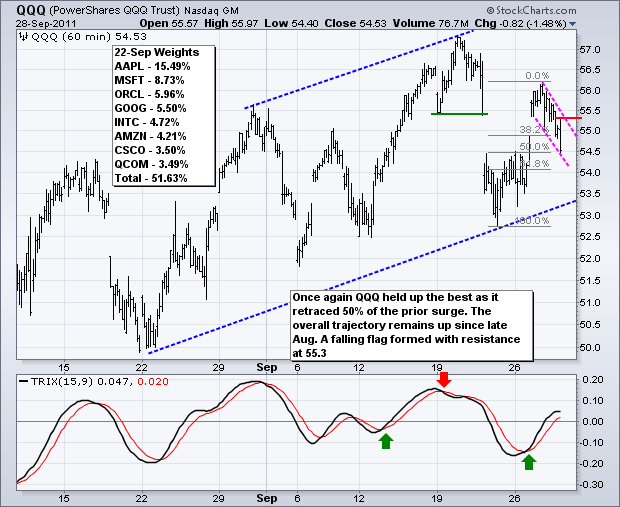
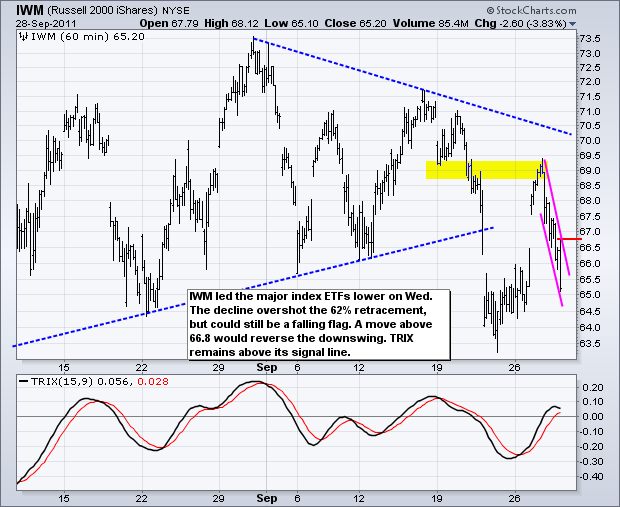
Stocks continued their choppy ways with small and mid-caps leading the market lower on Wednesday. Oil, industrial metals and gold were also down sharply. The Dollar moved higher and US Treasuries were flat. The big trend for the stock market is down after the August breakdown, but trading since early August has been extremely choppy. Trading the short-term swings requires vigilance throughout the day to control risk and catch the reversals. Truth-be-told, conditions are a little too choppy for my blood. SPY broke upswing support at 116 with a sharp decline, but the TRIX oscillator remains above its signal lie. TRIX measures the 1-day Rate-of-Change for the triple smoothed 15-period exponential moving average. Moving averages lag and a triple smoothed moving average lags even more. The decline over the last two days was very sharp and has yet to affect the TRIX. With yet another move below 116.5, SPY has now crossed this level at least 12 times since mid August. Even though the current swing is down (two days) and the bigger trend is down (four months), there is a trend in between these two trends that is flat (seven weeks). One day a bigger move will take hold, but for now anything is possible within this seven week trading range. The two day decline retraced 50-61.80% of the prior surge and formed a falling flag. This is a good spot for a reaction low and short-term move higher. A break above 117 would target further strength towards the big resistance zone in the 120-122 area.
**************************************************************************
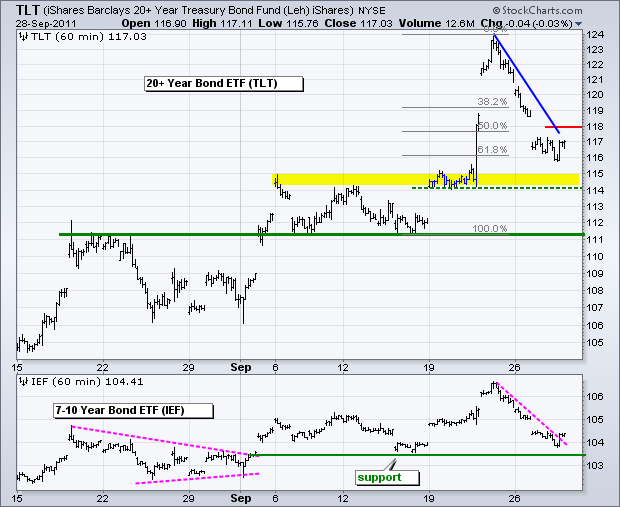
Despite a sharp decline in the stock market and modest advance in the Dollar, the 20+ year Bond ETF (TLT) traded relatively flat on Wednesday. The bigger trend remains up, but the current swing (four days) is down. TLT firmed near the 61.80% retracement mark and just above support from broken resistance. A move above 118 would reverse this downswing and call for a continuation of the bigger uptrend.
**************************************************************************
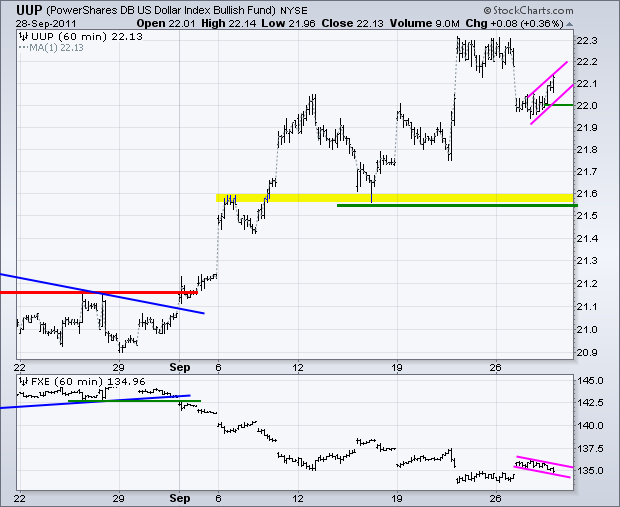
The US Dollar Fund (UUP) bounced back above 22.10 on Wednesday. While the major index ETFs have falling flags working, UUP has a rising flag taking shape on the 60-minute chart. The trend is clearly up as long as the flag rises. A move below 22 would break flag support and argue for a continuation lower. The downside target is not that deep because there is lots of support in the 21.6-21.8 area. This week's news flow is getting better out of Europe, but the European Central Bank (ECB) meets next week (Oct 6th) for its policy statement. Economic weakness and a fragile financial system could give way to a rate cut that would further weigh on the Euro (benefit the Dollar). Don't forget that Europe would like to see a weaker Euro. Germany is a big exporter and its products become more competitive with a weaker Euro.
**************************************************************************
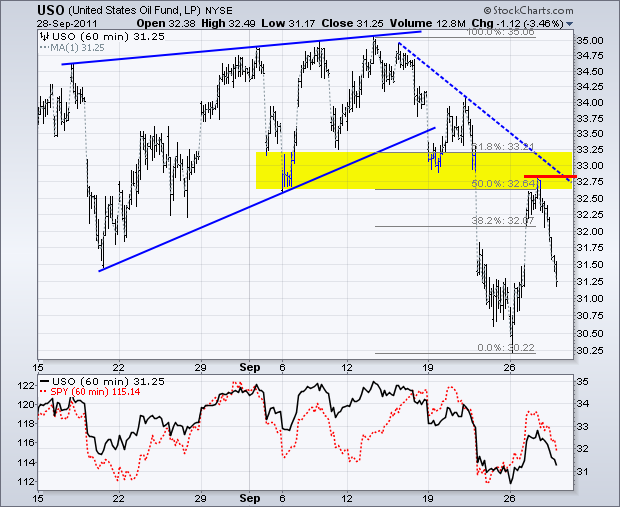
The US Oil Fund (USO) hit resistance and moved sharply lower on Wednesday. This is no doubt in response to the sharp decline in stocks, small and mid caps in particular. This move reinforces resistance in the 33 area. Key resistance is now based on this week's high. Oil will likely move higher if the major index ETFs break flag resistance levels put forth on the charts above.
**************************************************************************
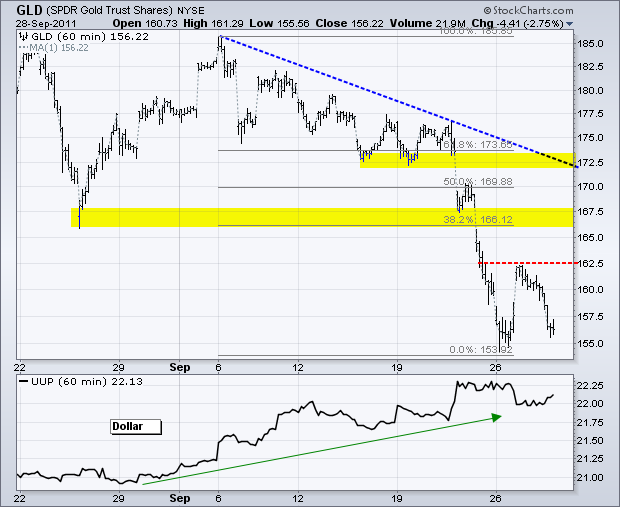
The Gold SPDR (GLD) is at an interesting juncture. With the decline back below 157.5, the ETF is testing the prior low around 155. A successful support test in GLD could foreshadow a bounce to the 166-167 area. The Dollar is down in early trading Thursday and this could give a lift to bullion. I am not sure how long a Euro rally/Dollar decline would last because I think the big trend for the Euro remains down.
**************************************************************************
Key Economic Reports:
Thu - Sep 29 - 08:30 - Initial Claims
Thu - Sep 29 - 08:30 - GDP
Thu - Sep 29 - 10:00 - Pending Home Sales
Thu - Sep 29 - 10:00 – German Parliament vote on EFSF
Fri - Sep 30 - 08:30 - Personal Income & Spending
Fri - Sep 30 - 09:45 - Chicago PMI
Fri - Sep 30 - 09:55 - Michigan Sentiment
Charts of Interest: Tuesday and Thursday in separate post.
This commentary and charts-of-interest are designed to stimulate thinking. This analysis is not a recommendation to buy, sell, hold or sell short any security (stock ETF or otherwise). We all need to think for ourselves when it comes to trading our own accounts. First, it is the only way to really learn. Second, we are the only ones responsible for our decisions. Think of these charts as food for further analysis. Before making a trade, it is important to have a plan. Plan the trade and trade the plan. Among other things, this includes setting a trigger level, a target area and a stop-loss level. It is also important to plan for three possible price movements: advance, decline or sideways. Have a plan for all three scenarios BEFORE making the trade. Consider possible holding times. And finally, look at overall market conditions and sector/industry performance.

