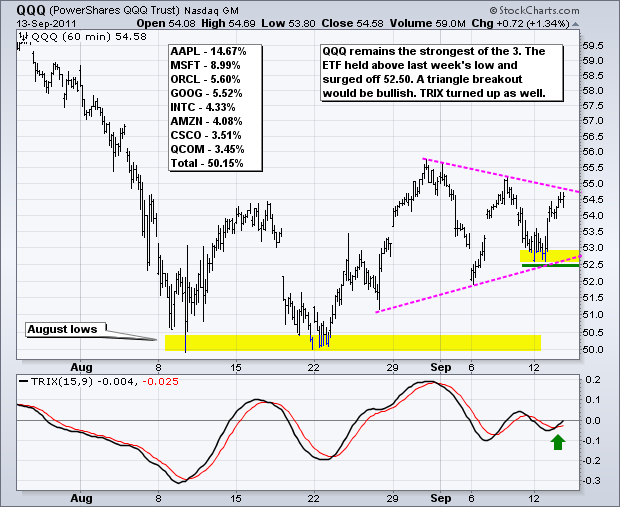
Stocks managed a half-hearted bounce on Tuesday for the second up day in a row. This is not bad considering the news backdrop (European debt and banks). Technical analysts are not so much interested in the news, but rather the market's reaction to the news. An advance on bad news is bullish, while a decline on good news is bearish. Even though the ability to rise in the face of bad news is bullish, I am a bit suspect because recent news has not US centric news. The real news test starts today with a fairly heavy docket. Retails sales and the Producer Price Index are on Wednesday. CPI, Industrial Production and the Philly Fed are on Thursday. Michigan Sentiment will be reported on Friday. It is a pretty big three days on the economic news front.
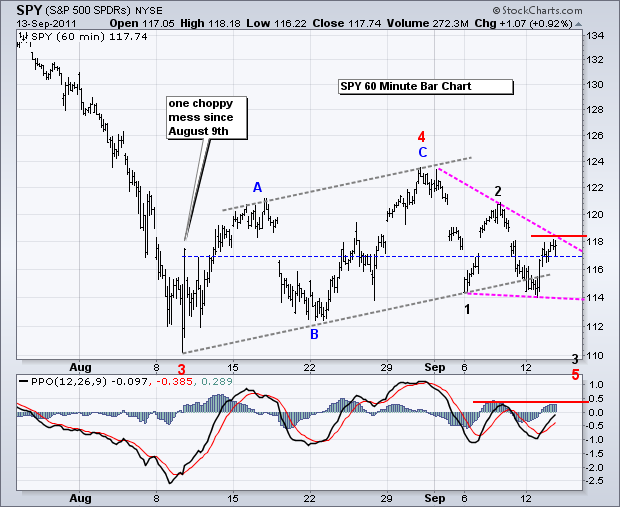
On the price charts, the S&P 500 ETF (SPY) has gone nowhere since August 9th. The ETF has moved above/below 117 at least 11 times in the last five weeks (blue dashed line). The short-term trend is down after last week's lower peak at 121 and this week's lower trough at 114. A falling wedge has taken shape and I am marking short-term resistance at 118.50. A move above this level would break the upper trendline of the falling wedge. Also look for the Percent Price Oscillator (PPO) to break last week's high to turn momentum bullish. Barring these breakouts, the short-term trend is down and a test of the August low is expected until this trend is reversed.
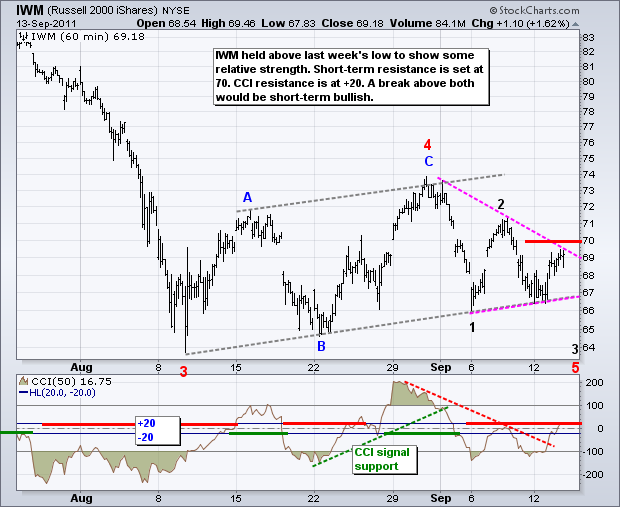
The 20+ year Bond ETF (TLT) broke to new highs in early September and then consolidated the last week or so. The breakout is holding and this is a consolidation in an uptrend. First support is at 111. A break below this level would argue for a deeper pullback and this would be bullish for stocks.
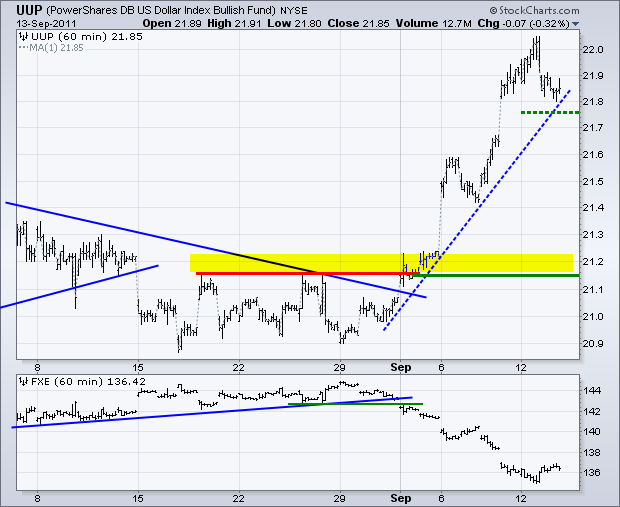
There is no change on the Dollar as the US Dollar Fund (UUP) remains in a sharp uptrend. There is a trendline extending up from late August that marks support in the 21.75 area. A move below this level could give way to a correction to the 21.50 area.
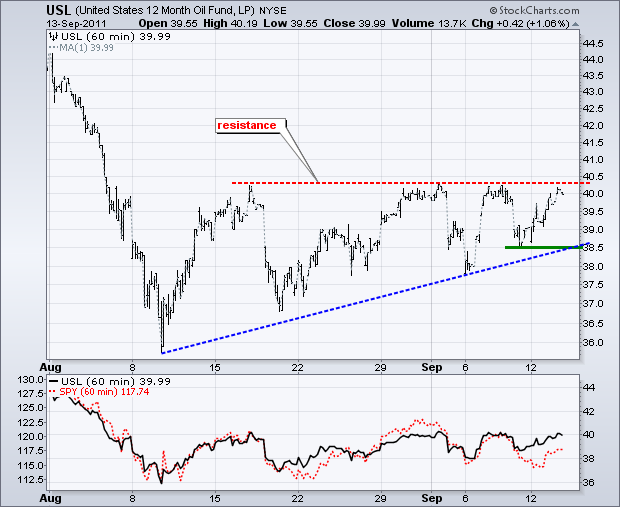
Oil remains surprisingly strong as the 12-Month US Oil Fund (USL) challenges resistance from the Ascending Triangle pattern. Oil is rising despite weakness in European stocks and strength in the Dollar. A breakout would target further strength to the 43-44 area. Key support is at 38.50.
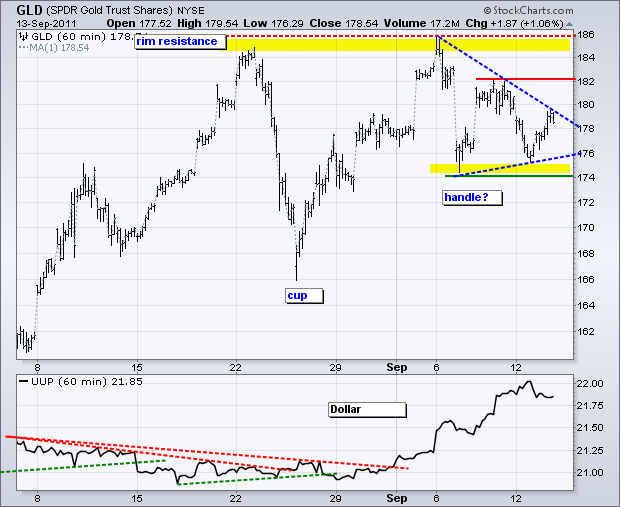
The Gold SPDR (GLD) got a decent bounce to affirm support in the 174-175 area. This level now holds the first key. A move below 174 would break a clear support zone and call for a deeper correction, perhaps back to the 166-168 area. It is also possible that a cup-with-handle is taking shape. A move above 182 is needed to start taking this pattern seriously.
Key Economic Reports:
Wed - Sep 14 - 07:00 - MBA Mortgage Index
Wed - Sep 14 - 08:30 - PPI
Wed - Sep 14 - 08:30 - Retail Sales
Wed - Sep 14 - 10:00 - Business Inventories
Wed - Sep 14 - 10:30 - Oil Inventories
Thu - Sep 15 - 08:30 - Jobless Claims
Thu - Sep 15 - 08:30 - CPI
Thu - Sep 15 - 08:30 - Empire State Manufacturing
Thu - Sep 15 - 09:15 - Industrial Production
Thu - Sep 15 - 09:15 - Capacity Utilization
Thu - Sep 15 - 10:00 - Philadelphia Fed
Thu - Sep 15 - 16:00 - Fed Balance Sheet/Money Supply
Fri - Sep 16 - 09:00 - Net Long-Term TIC Flows
Fri - Sep 16 - 09:55 - Michigan Sentiment
Charts of Interest: Tuesday and Thursday in separate post.
This commentary and charts-of-interest are designed to stimulate thinking. This analysis is not a recommendation to buy, sell, hold or sell short any security (stock ETF or otherwise). We all need to think for ourselves when it comes to trading our own accounts. First, it is the only way to really learn. Second, we are the only ones responsible for our decisions. Think of these charts as food for further analysis. Before making a trade, it is important to have a plan. Plan the trade and trade the plan. Among other things, this includes setting a trigger level, a target area and a stop-loss level. It is also important to plan for three possible price movements: advance, decline or sideways. Have a plan for all three scenarios BEFORE making the trade. Consider possible holding times. And finally, look at overall market conditions and sector/industry performance.

