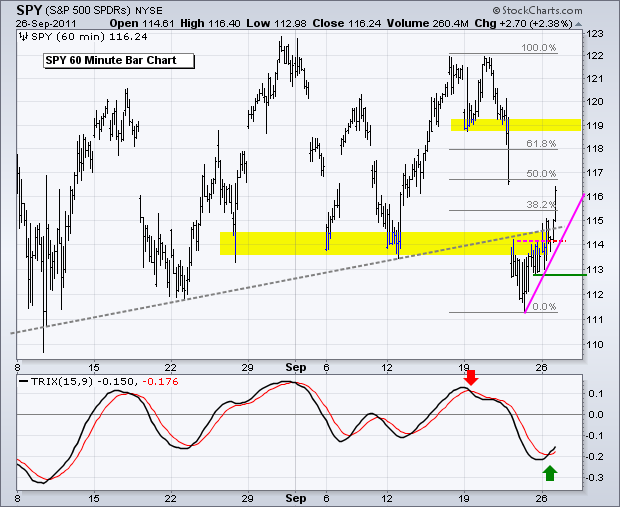
Stocks surged on Monday with the finance, energy and materials sectors leading the way. These three were also the most oversold. While Net Advancing Volume was fairly strong, Net Advances for the Nasdaq and NYSE were not that strong. Net Advances equals advancing issues less declining issues. Showing Net Advances as a ratio of total issues provides a percentage number. $NYAD:$NYTOT and $NAAD:$NATOT need to exceed 70% for a serious show of strength. Regardless, stock market advances at this stage are considered oversold bounces within a bigger downtrend. Short-term, the bears need to be careful because the powers that be are throwing huge amounts of money at the current financial crisis. This may not help in the long-term, but these massive rescue packages or announcements can produce some wild swings. Also note that sentiment seems to be excessively bearish after last week's decline. On the SPY chart, the ETF broke 114 and surged above 116 in the final hour. Broken support marks potential resistance in the 119 area and the 50-61.80% retracement zone marks a lower resistance area.
**************************************************************************
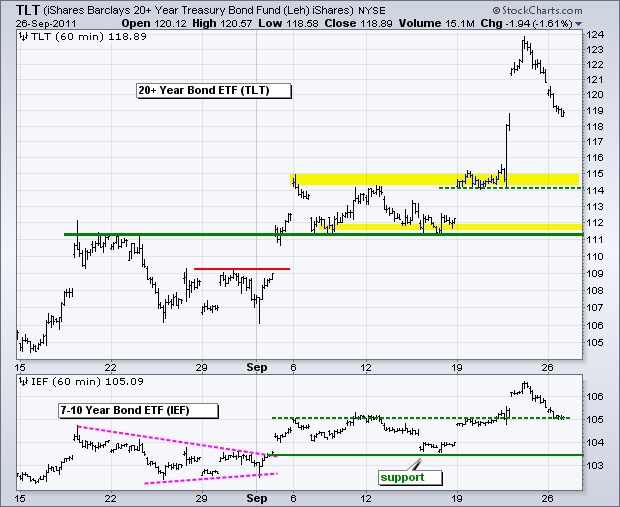
The 20+ year Bond ETF (TLT) corrected over the last two days with a decline from 124 to 119 (4%). Who would have thought that a 4% decline in two days would be a relatively small move in bonds? It is after the September surge. The big trend remains up with first support in the 114-115 area. Key support remains in the 111-112 area.
**************************************************************************
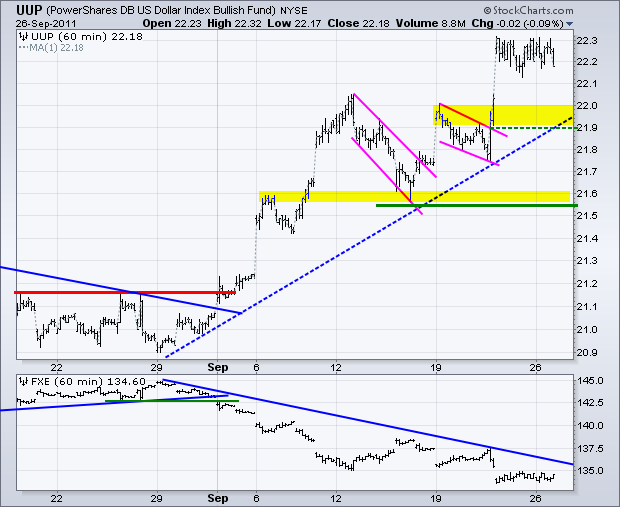
The US Dollar Fund (UUP) stalled as stocks rebounded and bonds fell. The Euro will once again be in a major spot light this week. The Greek parliament votes on a property tax today and the German parliament votes on increasing the European Financial Stability Facility (EFSF) on Thursday. UUP is currently consolidating within an uptrend. Broken resistance turns first support in the 21.9-22 area.
**************************************************************************
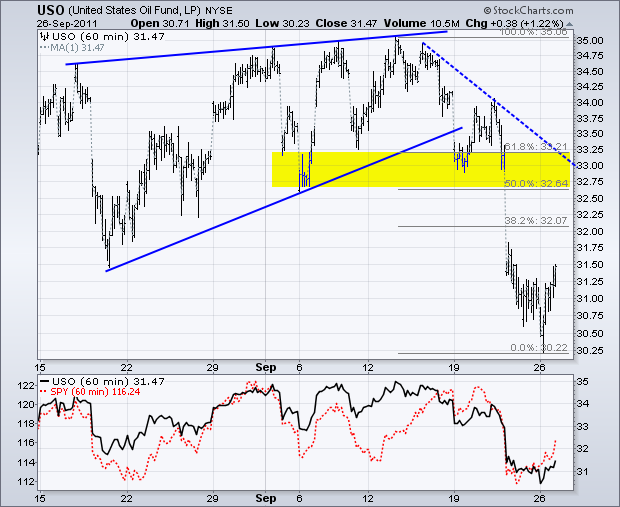
The US Oil Fund (USO) surged along with the stock market and oil futures are trading sharply higher this morning. Again, this is still considered an oversold bounce within a bigger downtrend. Broken supports, the 50-61.80% retracement zone and the dotted trendline mark resistance in the 33 area.
**************************************************************************
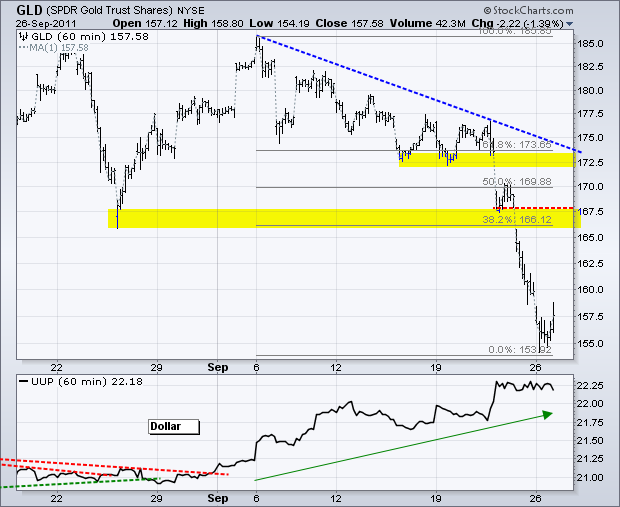
The Gold SPDR (GLD) hit 155 on the open and then bounced to close above 157.50 on Monday. Gold is way oversold, but still in a long-term uptrend and near major support on the weekly chart. Buying now is still for bottom-pickers and knife-catchers though. As far as a bounce is concerned, broken support and the 38.2% retracement mark first resistance in the 166-167 area.
**************************************************************************
Key Economic Reports:
Tue - Sep 27 - 09:00 - Case-Shiller Housing Index
Tue - Sep 27 - 10:00 - Consumer Confidence
Tue - Sep 27 - 12:00 – Greek vote on property tax
Wed - Sep 28 - 08:30 - Durable Orders
Wed - Sep 28 - 10:30 - Crude Inventories
Thu - Sep 29 - 08:30 - Initial Claims
Thu - Sep 29 - 08:30 - GDP
Thu - Sep 29 - 10:00 - Pending Home Sales
Thu - Sep 29 - 10:00 – German Parliament vote on EFSF
Fri - Sep 30 - 08:30 - Personal Income & Spending
Fri - Sep 30 - 09:45 - Chicago PMI
Fri - Sep 30 - 09:55 - Michigan Sentiment
Charts of Interest: Tuesday and Thursday in separate post.
This commentary and charts-of-interest are designed to stimulate thinking. This analysis is not a recommendation to buy, sell, hold or sell short any security (stock ETF or otherwise). We all need to think for ourselves when it comes to trading our own accounts. First, it is the only way to really learn. Second, we are the only ones responsible for our decisions. Think of these charts as food for further analysis. Before making a trade, it is important to have a plan. Plan the trade and trade the plan. Among other things, this includes setting a trigger level, a target area and a stop-loss level. It is also important to plan for three possible price movements: advance, decline or sideways. Have a plan for all three scenarios BEFORE making the trade. Consider possible holding times. And finally, look at overall market conditions and sector/industry performance.

