The financial markets are rather chaotic this morning. I say this because there was a dramatic about-face around 4AM ET when the Swiss National Bank announced a "floor" for the Euro. In effect, the Swiss said they would not tolerate a Euro/Swiss rate below 1.20 (1.20 Swiss Francs for one Euro). The Swiss Franc Trust (FXF) has appreciated significantly as a safe-haven currency with a 45+ percent move since July 2010. After being down sharply on Monday, the Euro rallied to move from a sizable loss to a sizable gain early Tuesday. This move caused some buying in stocks and oil as well as selling in gold and bonds. However, stocks are still headed for a sharply lower open and gold is still poised to open higher. Swiss intervention efforts to bolster their currency do not change anything in Europe or the US.
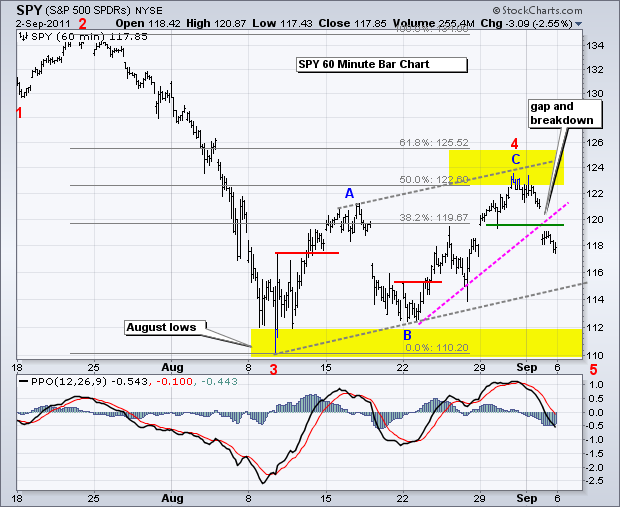
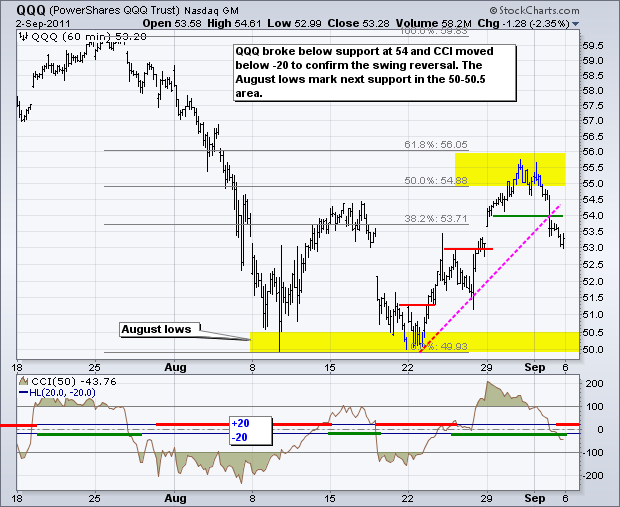
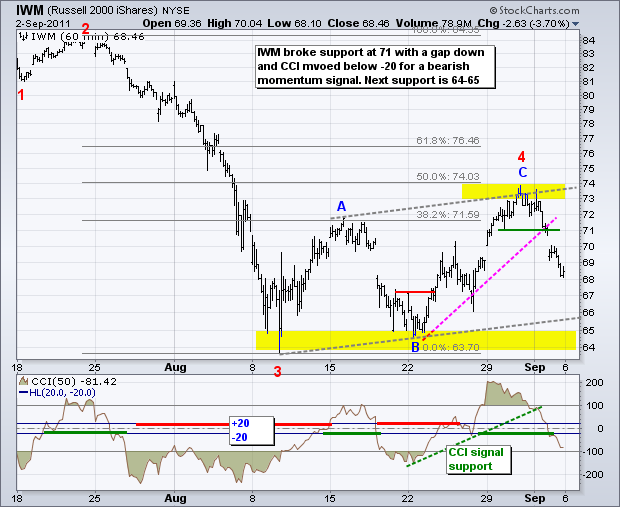
Turning to the major index ETFs, stocks gapped down on Friday and closed weak to signal an end to the August rally. On the SPY chart, this rally looked like Wave 4 of a 5-Wave decline. Also note that the advance from 9 to 31 August formed a rising flag on the daily charts. This is a bearish continuation pattern. All signs point to a break below the 9-Aug low and move towards long-term support in the 105-110 area, which marks the 2010 lows for SPY. Short-term, the August lows mark the next support levels for the major index ETFs. With a big gap down on Friday and another expected today, stocks have already made significant short-term moves. Even though the charts remain bearish, many stocks are already short-term oversold and I will forgo charts of interest until the dust settles.
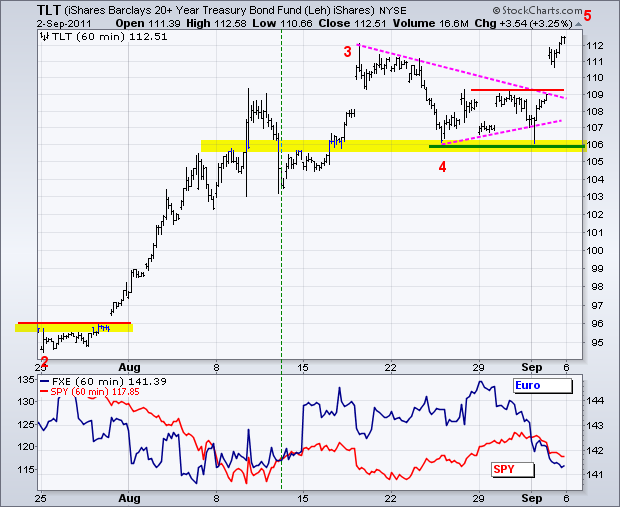
With stocks breaking down over the last few days and Europe in crisis mode, you can bet that the Fed will be looking for another kitchen sink to throw at the markets. We can call this QE3. While SPY is in a 5-Wave decline with the August lows marking next support, the 20+ year Bond ETF (TLT) is in a 5-Wave advance and already trading above its August highs. The gap and resistance break around 109 mark first support. The late August lows mark major support in the 106 area.
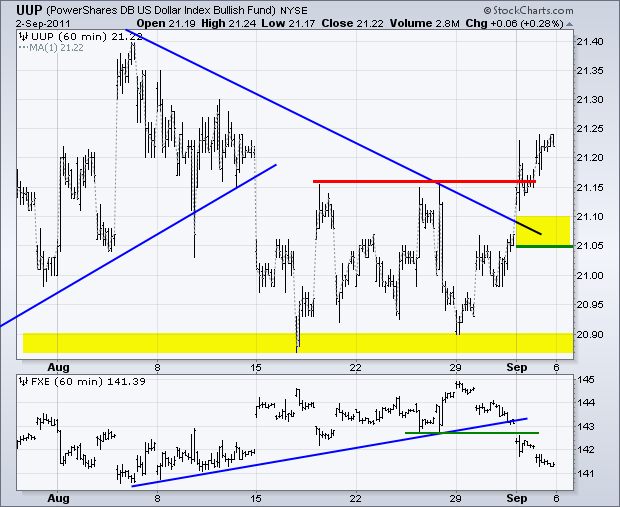
The US Dollar Fund (UUP) broke above resistance last week and this breakout is holding so far. The Dollar was up sharply against the Euro on Monday, but the move by the Swiss National Bank to peg the Euro/Swissy rate at 1.20 provided a boost to the Euro this morning. In theory, UUP was above its August high on Monday, but moved back below this level after this Swiss move. At this point, the breakout is holding and should be considered valid as long as UUP holds above the 21.05 level.
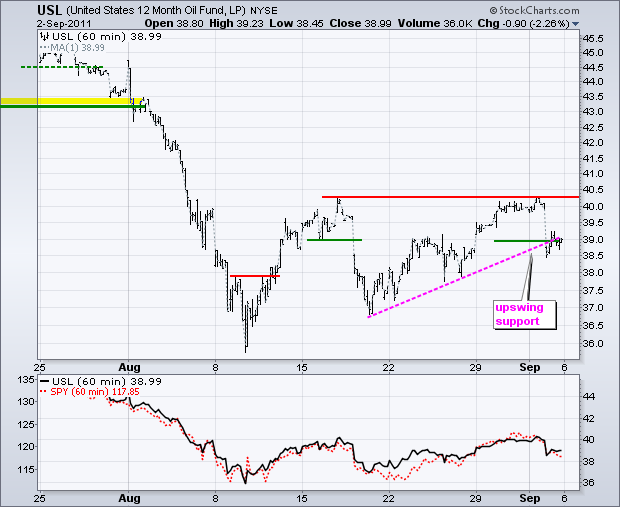
The 12-Month US Oil Fund (USL) is going the way of the stock market with a sharply lower open expected today. USL broke support on Friday, but managed to firm immediately after this support break. Nevertheless, there is clear resistance at 40.30 and the sharp move from resistance is bearish until proven otherwise.
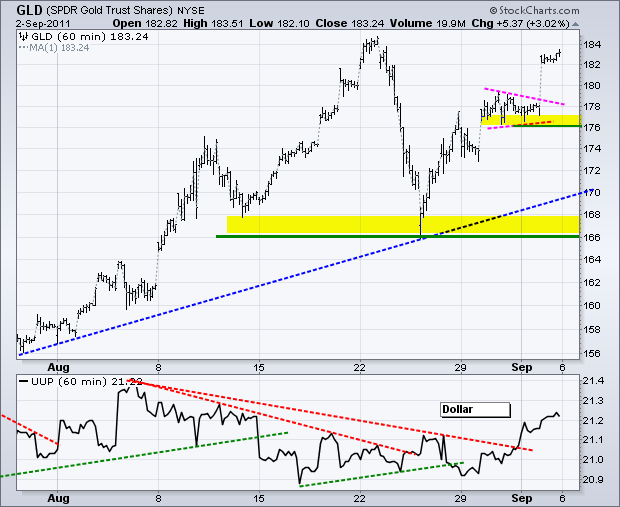
Gold remains on a planet of its own as the only serious alternative to currencies. Gold is also benefitting from a general flight to safety. The Gold SPDR (GLD) broke above pennant resistance last week and is poised to break above its August high today. First support is set at 176 and major support at 166.
Key Economic Reports:
Tue - Sep 06 - 10:00 - ISM Services
Wed - Sep 07 - 07:00 - MBA Mortgage Index
Wed - Sep 07 - 14:00 - Fed's Beige Book
Thu - Sep 08 - 08:30 - Initial Claims
Thu - Sep 08 - 11:00 - Crude Inventories
Thu - Sep 08 - 15:00 - Consumer Credit
Fri - Sep 09 - 10:00 - Wholesale Inventories
Charts of Interest: Tuesday and Thursday in separate post.
This commentary and charts-of-interest are designed to stimulate thinking. This analysis is not a recommendation to buy, sell, hold or sell short any security (stock ETF or otherwise). We all need to think for ourselves when it comes to trading our own accounts. First, it is the only way to really learn. Second, we are the only ones responsible for our decisions. Think of these charts as food for further analysis. Before making a trade, it is important to have a plan. Plan the trade and trade the plan. Among other things, this includes setting a trigger level, a target area and a stop-loss level. It is also important to plan for three possible price movements: advance, decline or sideways. Have a plan for all three scenarios BEFORE making the trade. Consider possible holding times. And finally, look at overall market conditions and sector/industry performance.

