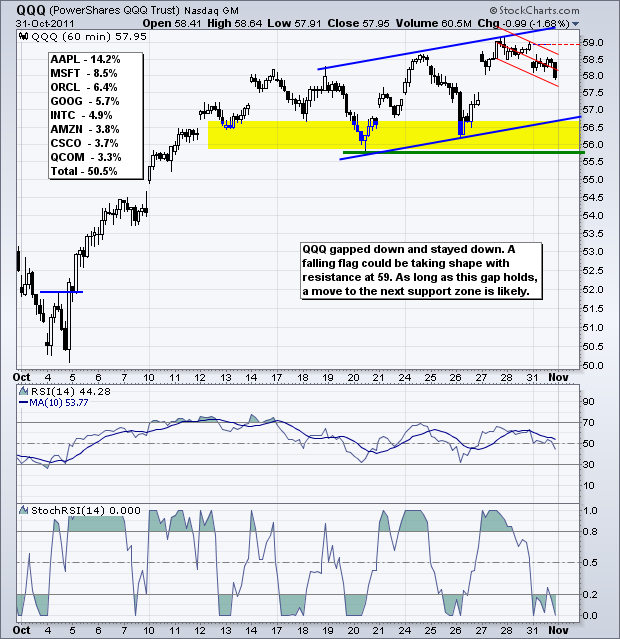
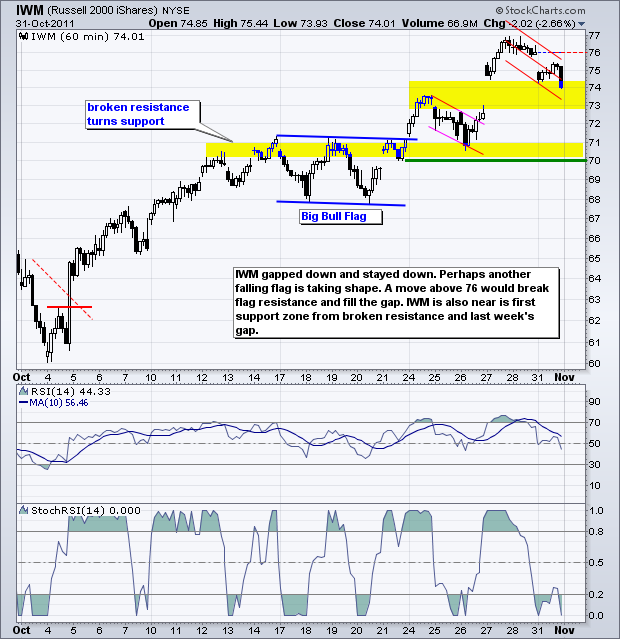
The market made a statement on Monday. After a big risk-on move last week, the market made a hard turn towards risk-off on Monday. It is just one day, but a bad week would likely suggest that the medium-term bullish signals seen over the last two weeks have been negated. The Euro led things off with a massive decline that erased last week's gain. This triggered trendline breaks in the US Dollar Fund (UUP) and 20+ year Bond ETF (TLT). Stocks and oil weakened, but did not reverse their short-term uptrends. It is a big week on the reporting front and any disappointments would further Monday's risk-off mood.
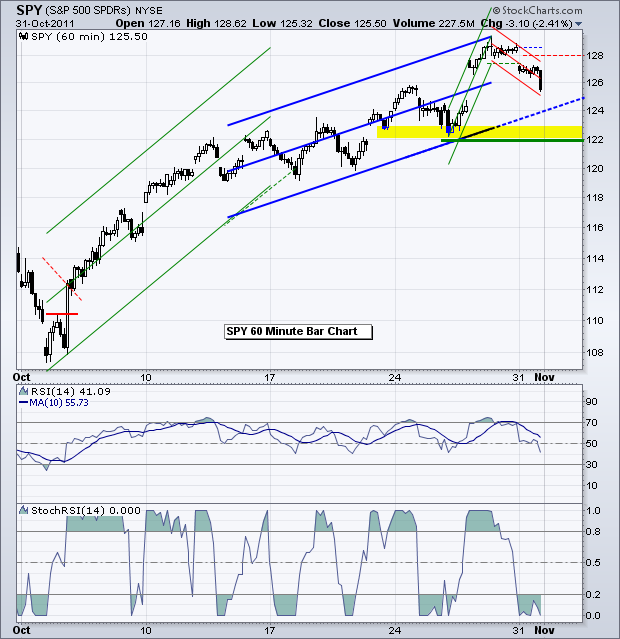
The S&P 500 ETF (SPY) broke upswing support with a gap down on the open. After stalling most of the day, the ETF moved sharply lower in the final hour. The combination of a weak open and weak close indicates that buyers were not willing to step in after the initial drop. Overall, the rising blue channel remains in place to capture the short-term uptrend. Key support remains at 122. The swing within this channel is down with resistance marked at 128.
**************************************************************************
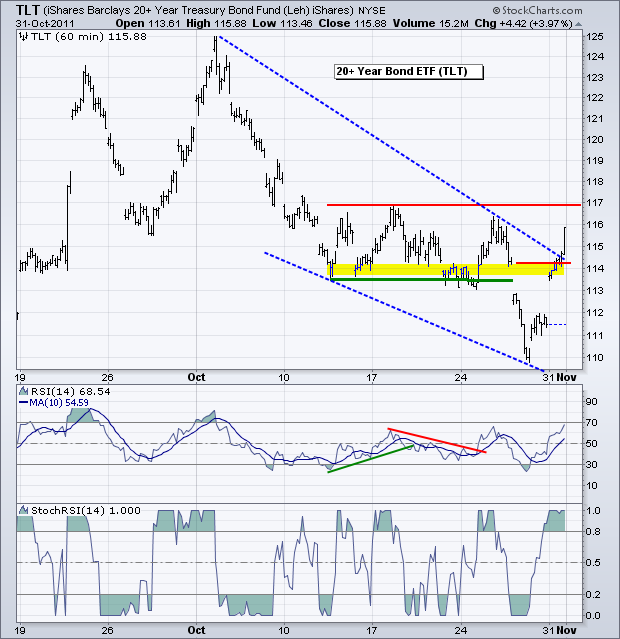
The 20+ year Bond ETF (TLT) made a big move on Monday as risk-off money flowed into Treasuries. This may have also helped the Dollar because foreign investors must buy Dollars before they can buy Treasuries. After breaking support in the 114 area, TLT moved right back above to set a bear trap. Sometimes a failed signal is as good as a signal. TLT went on to break trendline resistance and it looks like a new short-term uptrend is emerging here. Treasuries must still navigate the FOMC on Wednesday and the employment report on Friday.
**************************************************************************
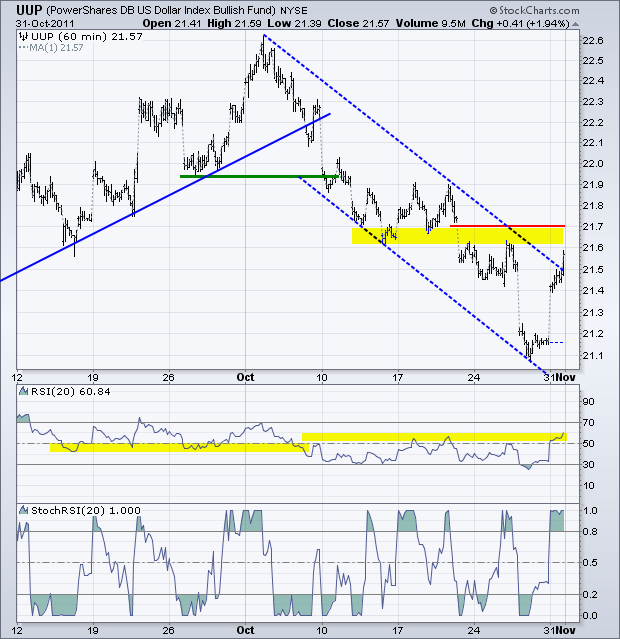
The US Dollar Fund (UUP) followed Treasuries higher with a move above the channel trendline. UUP still has resistance at 21.7 just ahead and RSI has resistance at 60. Follow through breakouts would confirm a trend reversal in the greenback. If prior relationships continue, a new uptrend in the Dollar would be bearish for stocks.
**************************************************************************
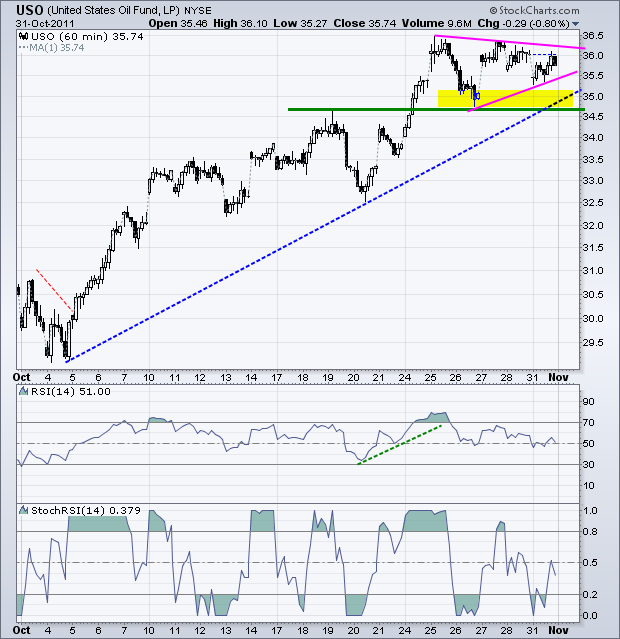
The US Oil Fund (USO) held up pretty well considering weakness in stocks and strength in the Dollar. I would not, however, expect oil to continue holding up if stocks and the Euro weaken further. USO formed a triangle over the last few days. A break above 36 would signal a continuation higher. Key support is set at 34 (broken resistance, last week's low and the early October trendline). A move below this level would reverse the 4-5 week uptrend.
**************************************************************************
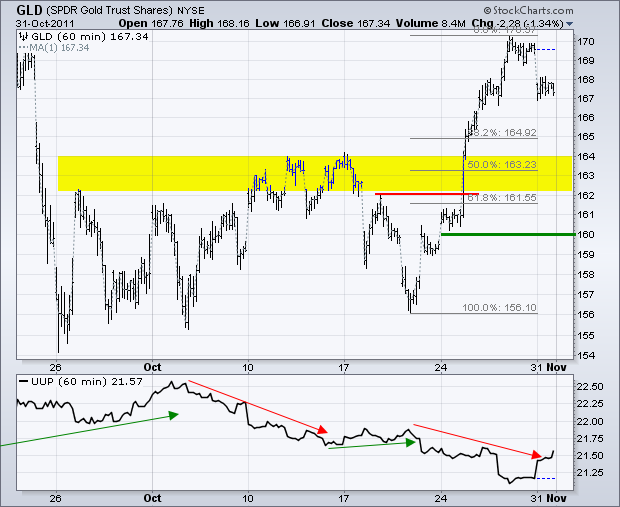
Gold could be a wild card here. Will gold continue to follow the Dollar or will gold get a mind of its own? The Gold SPDR (GLD) broke resistance with a big surge last week and broken resistance turns into support. Support in the 162-164 area is further confirmed by the 50-61.80% retracement zone. This is the first area to expect support on a throwback.
**************************************************************************
Key Economic Reports:
Tue - Nov 01 - 10:00 - ISM Index
Tue - Nov 01 - 10:00 - Construction Spending
Tue - Nov 01 - 15:00 - Auto/Truck Sales
Wed - Nov 02 - 07:00 - MBA Mortgage Index
Wed - Nov 02 - 07:30 - Challenger Job Cuts
Wed - Nov 02 - 08:15 - ADP Employment Change
Wed - Nov 02 - 10:30 - Oil Inventories
Wed - Nov 02 - 12:30 - FOMC Rate Decision
Thu - Nov 03 - 08:30 - Jobless Claims
Thu - Nov 03 - 10:00 - Factory Orders
Thu - Nov 03 - 10:00 - ISM Services
Fri - Nov 04 - 08:30 - Employment Report
Charts of Interest: Tuesday and Thursday in separate post.
This commentary and charts-of-interest are designed to stimulate thinking. This analysis is not a recommendation to buy, sell, hold or sell short any security (stock ETF or otherwise). We all need to think for ourselves when it comes to trading our own accounts. First, it is the only way to really learn. Second, we are the only ones responsible for our decisions. Think of these charts as food for further analysis. Before making a trade, it is important to have a plan. Plan the trade and trade the plan. Among other things, this includes setting a trigger level, a target area and a stop-loss level. It is also important to plan for three possible price movements: advance, decline or sideways. Have a plan for all three scenarios BEFORE making the trade. Consider possible holding times. And finally, look at overall market conditions and sector/industry performance.

