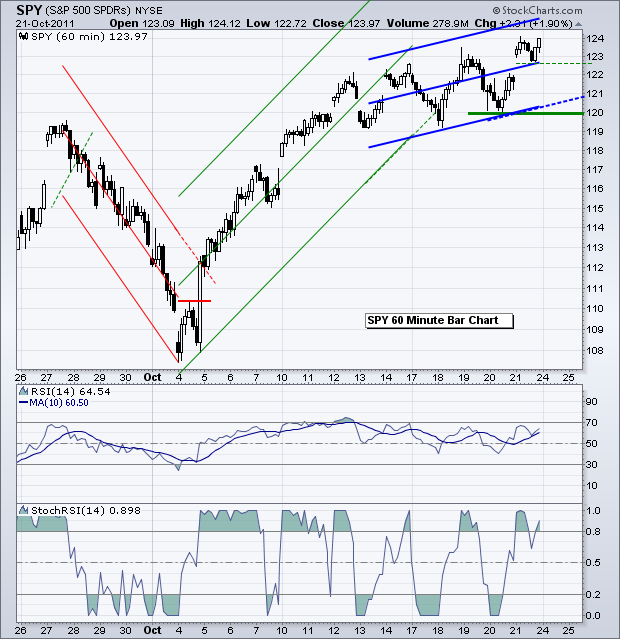
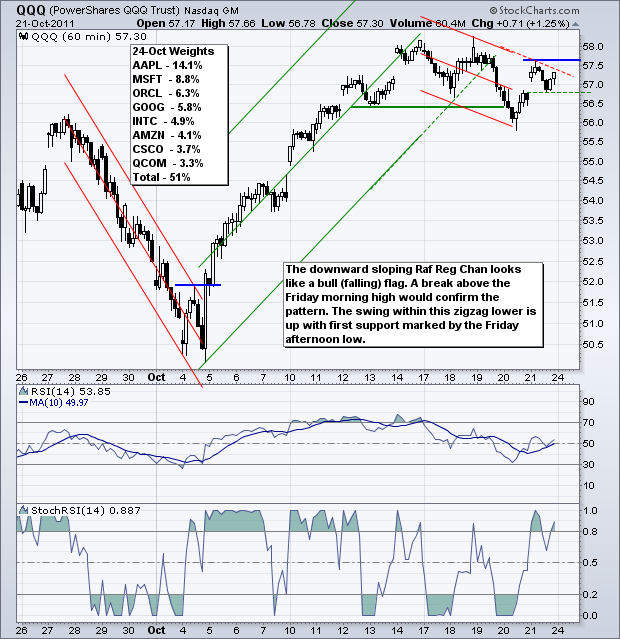
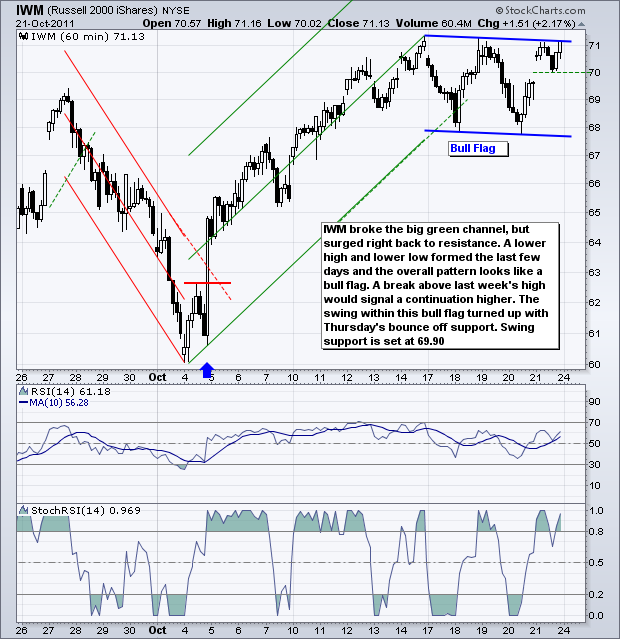
Stocks opened strong with a gap on Friday morning, consolidated and then closed strong. With another advance, the S&P 500 ETF (SPY) moved to a new high for the move as it broke above its mid October highs. The Russell 2000 ETF (IWM) is challenging its mid October highs, while the Nasdaq 100 ETF (QQQ) remains with lower highs the last 5-10 days. Leadership from the finance and consumer discretionary sectors in October has put SPY in the driver's seat. On the price chart, SPY has been working its way higher with rising peaks and rising troughs since October 12th. There are at least six swings within this rising channel. The current swing is up with support based on the Friday afternoon low. As far as the 60-minute chart is concerned, the rising channel marks an uptrend with key support at 120. This is the week that the rumors become news. Earning season will wind down and we are likely to get a grandiose announcement from EU officials (perhaps Wednesday). Stocks have been rallying in anticipation of these news events and we may see some profit taking once the news hits the fan.
**************************************************************************
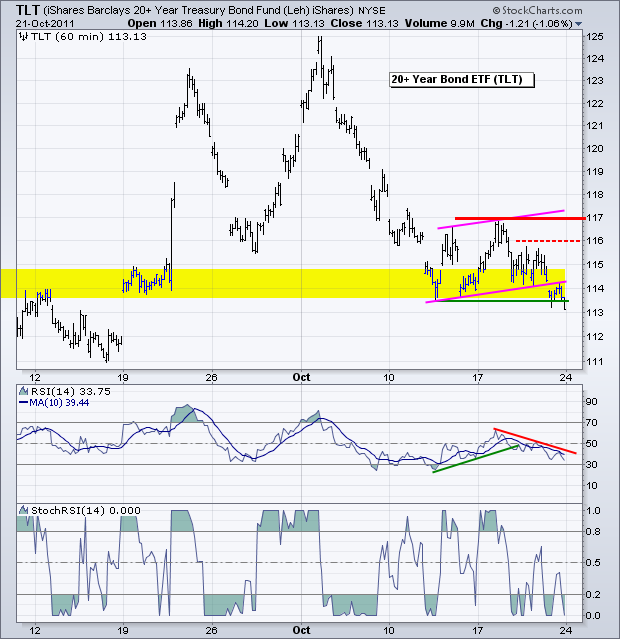
The 20+ year Bond ETF (TLT) opened lower and closed below its mid October lows. The ETF broke rising flag support as well. This signals a continuation lower and reinforces resistance at 117. A quick reversal above 116 would suggest a bear trap. Treasuries continue to show positive correlation with the Euro and negative correlation with stocks.
**************************************************************************
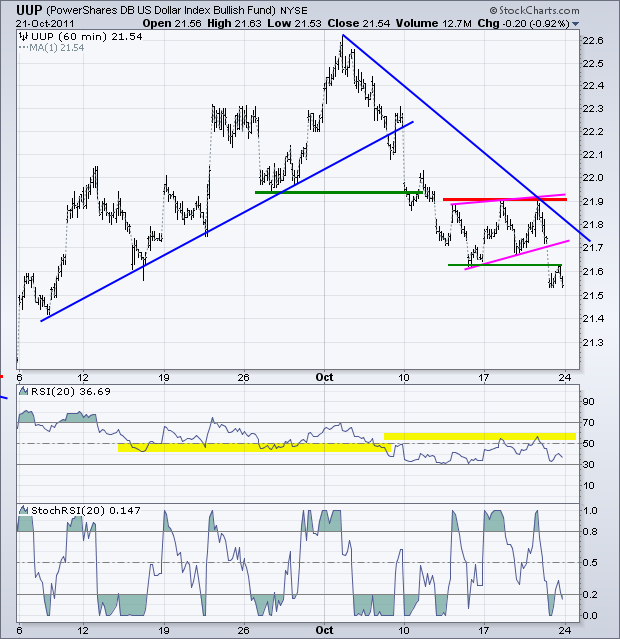
The US Dollar Fund (UUP) broke below its mid October lows with a sharp move lower on Friday. This means the inverse Head-and-Shoulders pattern did not pan out as resistance held throughout the week. With a reassessment, it looks like UUP broke support from a rising wedge. This break signals a continuation of the current downtrend and reinforces resistance in the 21.90 area. Look for a break above last week's highs to reverse the downtrend. Notice that RSI held support in the 40-50 zone during the uptrend and met resistance in the 50-60 zone during the downtrend. A break above 60 is needed to turn momentum bullish.
**************************************************************************
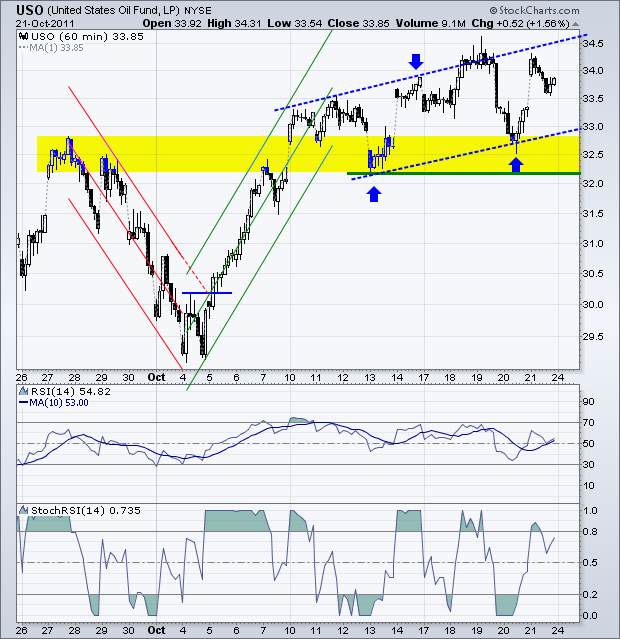
The swings in the US Oil Fund (USO) are not conforming to the Raff Regression Channel so I am removing this indicator in favor of basic trend analysis. USO surged with the market in early October and then zigzagged higher the last two weeks. The swings within this zigzag are quite sharp, but there are clearly rising troughs and rising peaks. Broken resistance in the 32.50 area turned into a support zone. A break below the mid October lows would reverse this uptrend. Oil is positively correlated to stocks and the Euro.
**************************************************************************
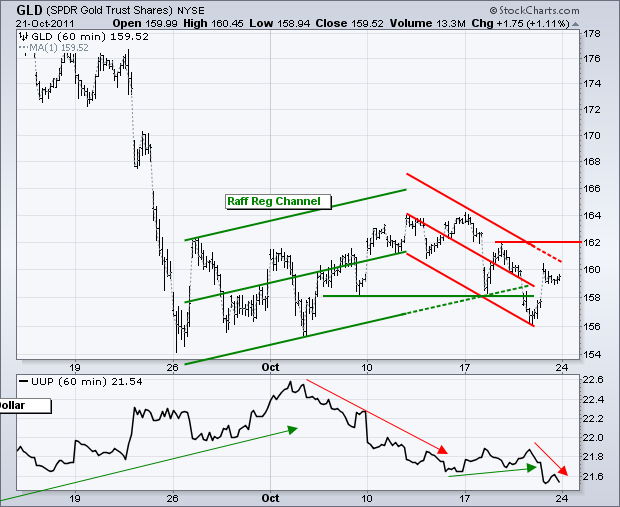
The Gold SPDR (GLD) is all over the place as it bounces within a range the last four weeks. The range lows are around 154 and the range highs around 164. The swing turned down with the break below 158 last week, but GLD immediately recovered with a surge back above 159. A signal that fails this quick should be a warning sign for the bears. Resistance is set at 162 and a break above this level would fully reverse the one week downswing.
**************************************************************************
Key Economic Reports:
Tue - Oct 25 - 09:00 - Case-Shiller 20-city Index
Tue - Oct 25 - 10:00 - Consumer Confidence
Tue - Oct 25 - 10:00 - FHFA Housing Price Index
Wed - Oct 26 - 07:00 - MBA Mortgage Index
Wed - Oct 26 - 08:30 - Durable Orders
Wed - Oct 26 - 10:00 - New Home Sales
Wed - Oct 26 - 10:30 - Oil Inventories
Wed - Oct 26 - 10:30 - EU Summit II
Thu - Oct 27 - 08:30 - Jobless Claims
Thu - Oct 27 - 08:30 - Advance GDP Q3
Thu - Oct 27 - 10:00 - Pending Home Sales
Fri - Oct 28 - 08:30 - Personal Income/Spending
Fri - Oct 28 - 09:55 - Michigan Sentiment
Charts of Interest: Tuesday and Thursday in separate post.
This commentary and charts-of-interest are designed to stimulate thinking. This analysis is not a recommendation to buy, sell, hold or sell short any security (stock ETF or otherwise). We all need to think for ourselves when it comes to trading our own accounts. First, it is the only way to really learn. Second, we are the only ones responsible for our decisions. Think of these charts as food for further analysis. Before making a trade, it is important to have a plan. Plan the trade and trade the plan. Among other things, this includes setting a trigger level, a target area and a stop-loss level. It is also important to plan for three possible price movements: advance, decline or sideways. Have a plan for all three scenarios BEFORE making the trade. Consider possible holding times. And finally, look at overall market conditions and sector/industry performance.

