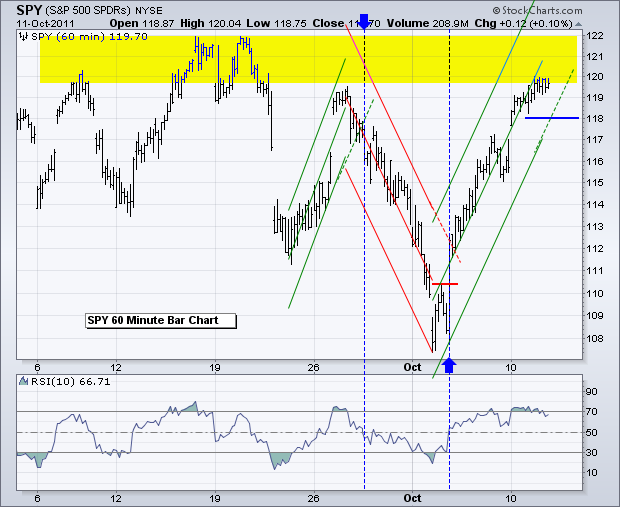
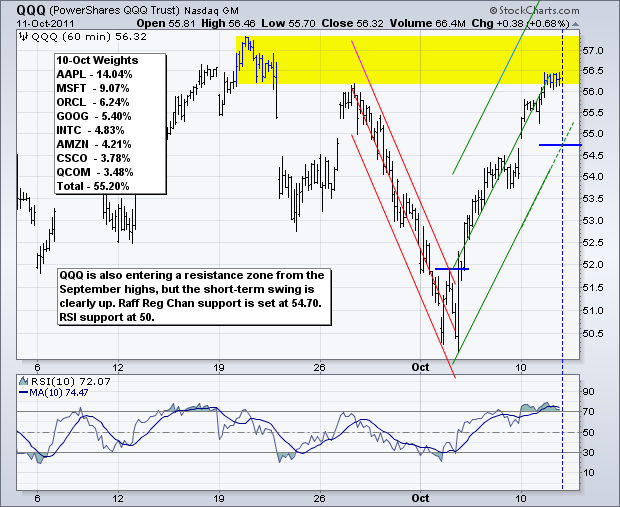
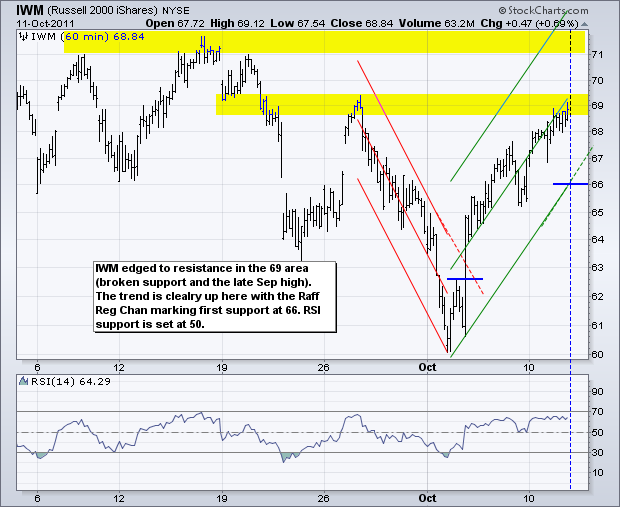
Earnings season kicked off on Tuesday and stocks stalled in mixed trading. A mere six days ago, the S&P 500 ETF (SPY) was trading around 108, just before the big Tuesday turnaround on October 4th. The ETF was then down some 14% from its September high and around 20% from its July high. At 108, the market was priced for bad news on the earnings front and the economy. With the ETF up around 11% from last week's low, it is priced for some better news on earnings and the economy. Failure to deliver could knock prices back towards last week's lows. We saw this with Alcoa as it was hit after a poor report after hours. Also keep in mind that SPY has been locked within a trading range since early August (±108 to ±123). On the chart, SPY is trading near a resistance zone from the September highs (119.5-122). The ETF is also short-term overbought, but the short-term trend is clearly up with no signs of weakness just yet. The Raff Regression Channel extension marks first support at 118. RSI support is set at 50. A move below both levels would reverse this short-term upswing. There are no major changes on the intermarket charts. Bonds remain in a downswing, the Dollar in a downswing, Oil in an upswing and Gold in an upswing. In addition to earnings seasons, there are a slew of speeches this afternoon: three Fed governors and European Central Bank chief Trichet.
**************************************************************************
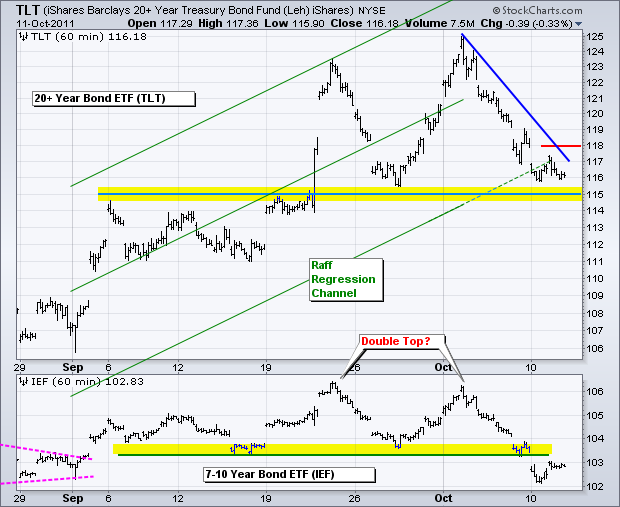
Bonds are unlikely to turn up unless stocks reverse their upswing. The 20+ year Bond ETF (TLT) has been moving lower since the Tuesday reversal and is now down around 8% from its high. There is, however, support at hand from broken resistance and the late September low (115 area). Downswing resistance is set at 118.
**************************************************************************
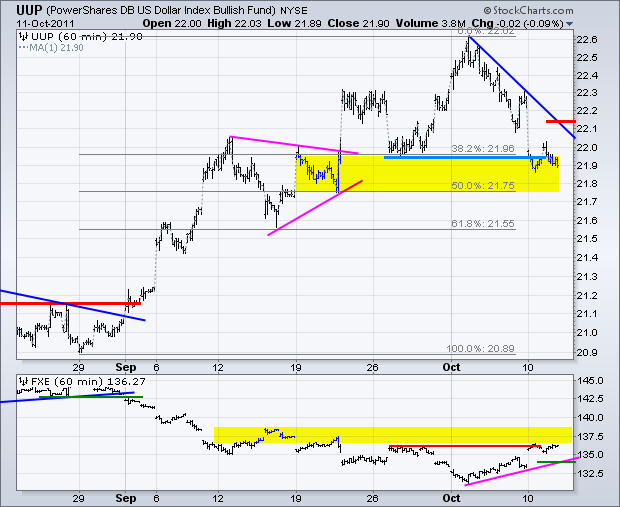
The US Dollar Fund (UUP) is trading at the top of a support zone. The 38-50% retracement zone and the triangle apex mark support here. This decline is still considered a correction within a bigger uptrend. Downswing resistance is set at 22.15.
**************************************************************************
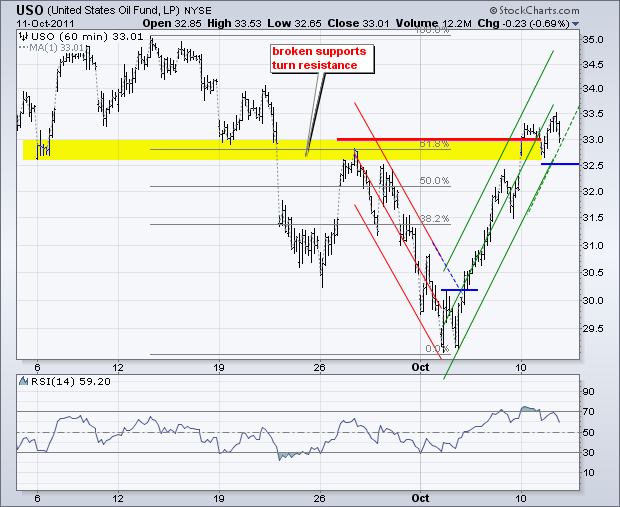
The US Oil Fund (USO) is trading near a resistance zone around 33. The ETF stalled the last 2-3 days with movements above/below this level. The swing is up as the ETF holds within the steep Raff Regression Channel. I am marking chart support at 32.50, which is yesterday's low. RSI support is set at 50 and can be used to confirm a support break on the price chart.
**************************************************************************
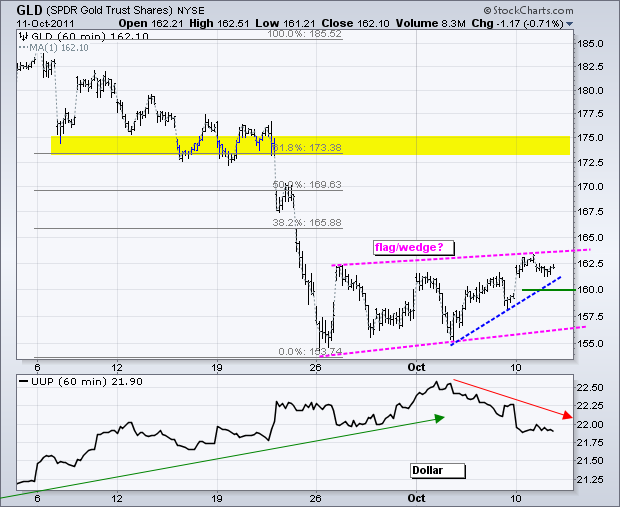
Weakness in the Dollar continues to prop up gold. The Gold SPDR (GLD) is trading near the top of its 2 1/2 week range. The advance since late September looks like a bearish flag. A break below 155 would confirm this pattern and signal a continuation of the September decline. This would probably coincide with an upside breakout in the Dollar. Within the flag, I am marking first support at 160. This is a minor support level that may provide an early warning. Caution: early warnings come with higher chances of whipsaw.
**************************************************************************
Key Economic Reports:
Wed - Oct 12 - 07:00 - MBA Mortgage Index
Thu - Oct 13 - 08:30 - Jobless Claims
Thu - Oct 13 - 11:00 - Oil Inventories
Fri - Oct 14 - 08:30 - Retail Sales
Fri - Oct 14 - 09:55 - Michigan Sentiment
Fri - Oct 14 - 10:00 - Business Inventories
Sun – Oct 17 – 10:00 – European Debt Summit
Charts of Interest: Tuesday and Thursday in separate post.
This commentary and charts-of-interest are designed to stimulate thinking. This analysis is not a recommendation to buy, sell, hold or sell short any security (stock ETF or otherwise). We all need to think for ourselves when it comes to trading our own accounts. First, it is the only way to really learn. Second, we are the only ones responsible for our decisions. Think of these charts as food for further analysis. Before making a trade, it is important to have a plan. Plan the trade and trade the plan. Among other things, this includes setting a trigger level, a target area and a stop-loss level. It is also important to plan for three possible price movements: advance, decline or sideways. Have a plan for all three scenarios BEFORE making the trade. Consider possible holding times. And finally, look at overall market conditions and sector/industry performance.

