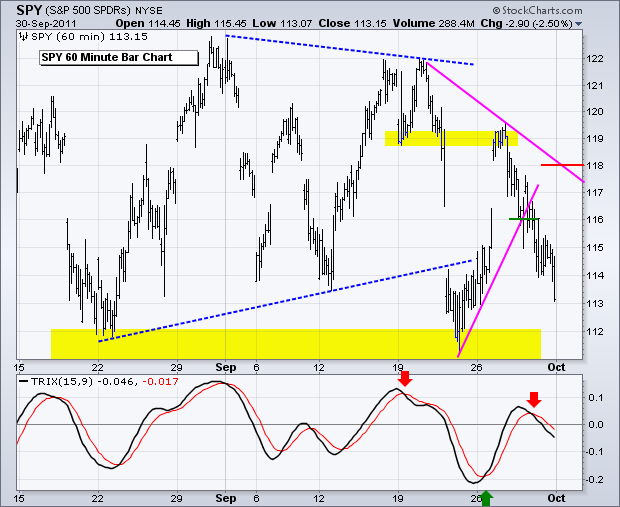
The S&P 500 ETF (SPY) broke down with a move below 114, but surged right back to broken support in the 119 area. Talk about a vicious bull trap. The ETF ultimately formed a lower high below 120 and moved sharply lower the last three days. SPY broke the upswing trendline and support at 116 on Wednesday. This breakdown was not so clear cut as the ETF surged right back above 117 with Thursday's open. However, the gap open was all the bulls could muster as the ETF moved to new lows by Friday. The big trend (few months) was always down, the medium trend (several weeks) was flat and the short-term trend was down. With the lower high and breakdown, the medium trend is also down now. This means all three trends are clearly down. Also note that the TRIX broke below its signal line on Thursday. It was a bit late to the party, but a triple smoothed exponential moving average is not a leading indicator. By the way, it is a big week on the economic calendar.
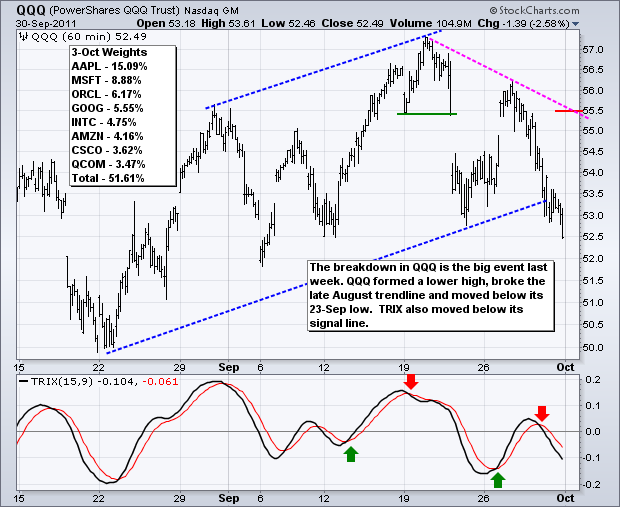
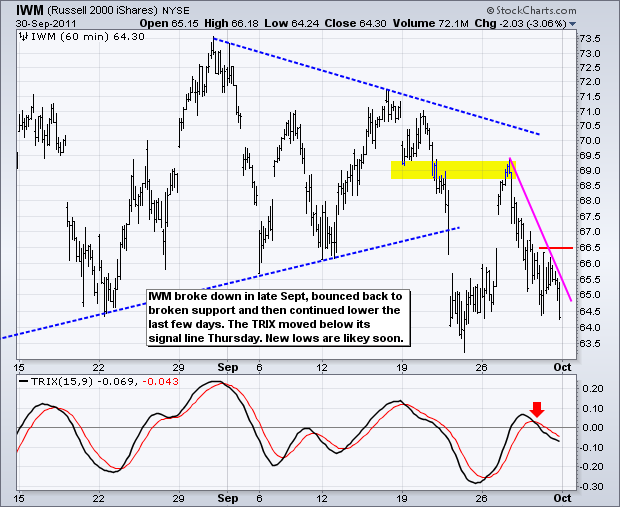
**************************************************************************
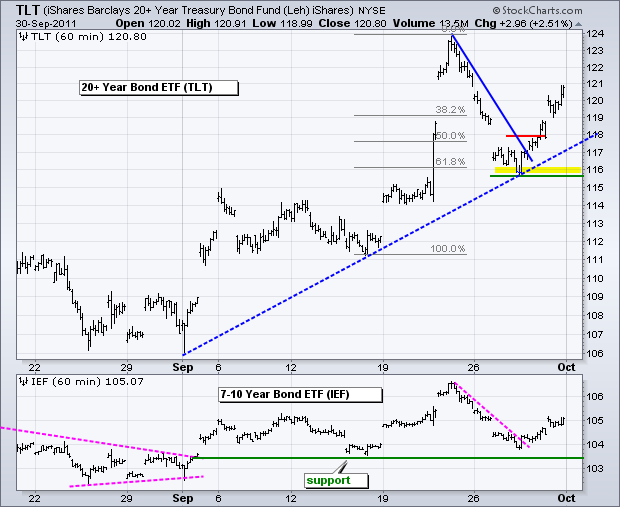
The 20+ year Bond ETF (TLT) extended its gains as stocks moved sharply lower on Friday. The bigger trend for TLT is clearly up. After a pullback that retraced around 61.80%, the ETF found support near 116 and broke resistance at 118 with a move on Thursday. This move reinforces support in the 116 area. Bonds are likely to attract money as long as stocks and the Euro are weak. The Fed is also buying long-term bonds.
**************************************************************************
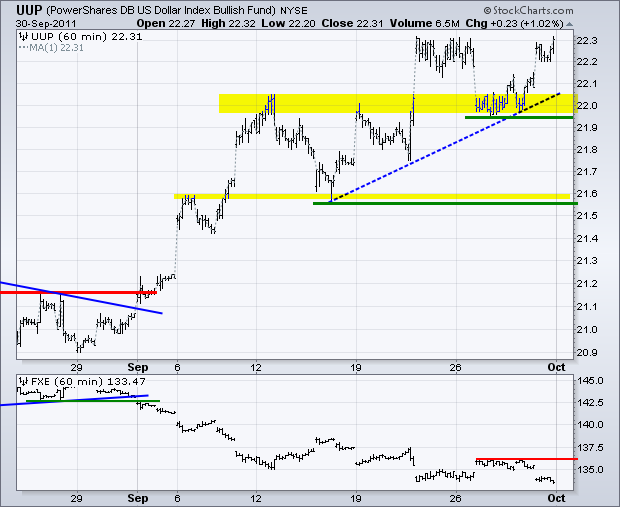
The US Dollar Fund (UUP) moved higher as money moved out of the Euro again on Friday. The Euro Currency Trust (FXE) failed at resistance as UUP held support. Friday's gain reinforces support in the 22 area. A move below last week's low would reverse the short-term uptrend. In addition to the normal news flow surrounding Greek/Euro/Bank debt, note that the European Central Bank (ECB) meets on Thursday (Oct 6th) for its policy statement. Economic weakness and a fragile financial system could give way to a rate cut that would further weigh on the Euro (benefit the Dollar).
**************************************************************************
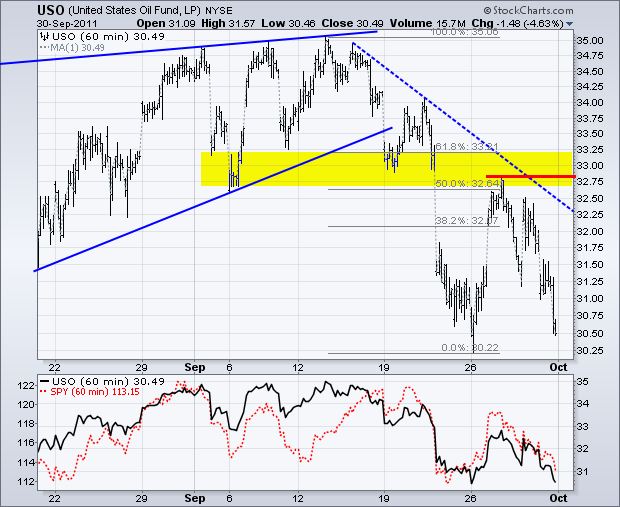
The US Oil Fund (USO) bounced along with the stock market early last week and fell with the stock market late last week. After meeting resistance at broken support and the 50% retracement, USO fell sharply and is now near its 26-Sep low. With further weakness in stocks expected this morning, oil is also likely to decline and break to new lows.
**************************************************************************
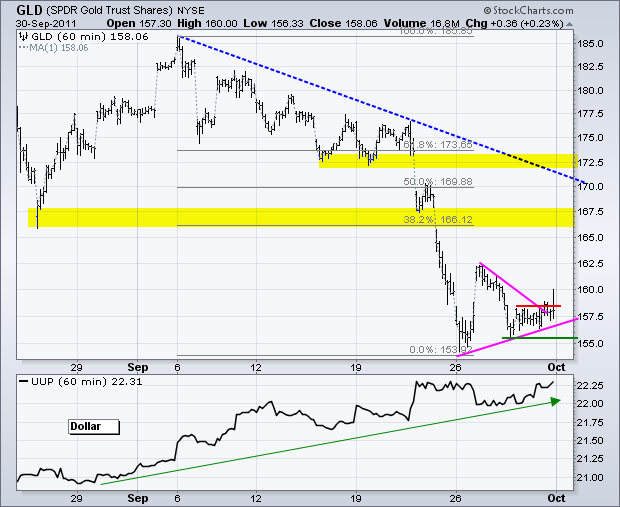
The Gold SPDR (GLD) was at a very interesting spot on Wednesday-Thursday and made a breakout attempt on Friday. While the gains did not hold, it is important to note that gold held firm in the face of serious Dollar strength on Friday. Gold was weighed down by overbought conditions and a strong Dollar in September. However, it now looks like gold may be poised to move on its own merits as the yellow metal is up sharply in early trading on Monday. The 166-167 area marks the first target. I am marking support just above 155.
**************************************************************************
Key Economic Reports:
Mon - Oct 03 - 10:00 - ISM Manufacturing Index
Mon - Oct 03 - 10:00 - Construction Spending
Mon - Oct 03 - 15:00 - Auto/Truck Sales
Tue - Oct 04 - 10:00 - Factory Orders
Wed - Oct 05 - 07:00 - MBA Mortgage Index
Wed - Oct 05 - 07:30 - Challenger Job Cuts
Wed - Oct 05 - 08:15 - ADP Employment Change
Wed - Oct 05 - 10:00 - ISM Services Index
Wed - Oct 05 - 10:30 - Oil Inventories
Thu - Oct 06 - 08:30 - Jobless Claims
Fri - Oct 07 - 08:30 - Employment Reprot
Fri - Oct 07 - 15:00 - Consumer Credit
Charts of Interest: Tuesday and Thursday in separate post.
This commentary and charts-of-interest are designed to stimulate thinking. This analysis is not a recommendation to buy, sell, hold or sell short any security (stock ETF or otherwise). We all need to think for ourselves when it comes to trading our own accounts. First, it is the only way to really learn. Second, we are the only ones responsible for our decisions. Think of these charts as food for further analysis. Before making a trade, it is important to have a plan. Plan the trade and trade the plan. Among other things, this includes setting a trigger level, a target area and a stop-loss level. It is also important to plan for three possible price movements: advance, decline or sideways. Have a plan for all three scenarios BEFORE making the trade. Consider possible holding times. And finally, look at overall market conditions and sector/industry performance.

