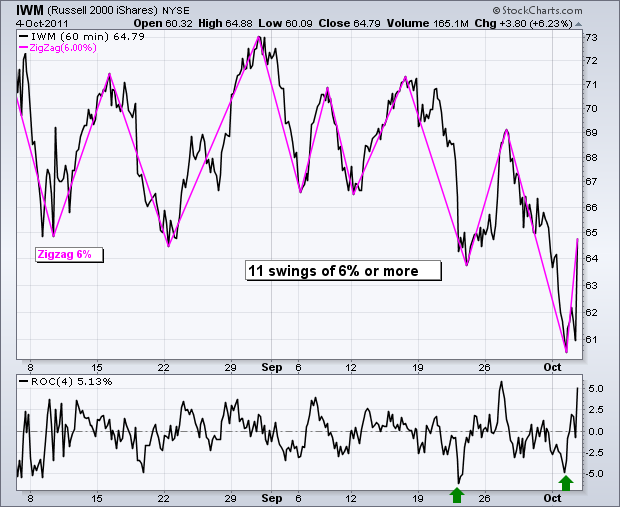
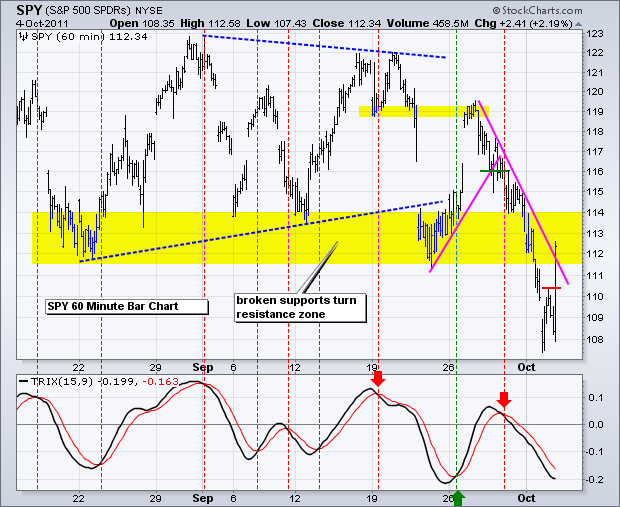
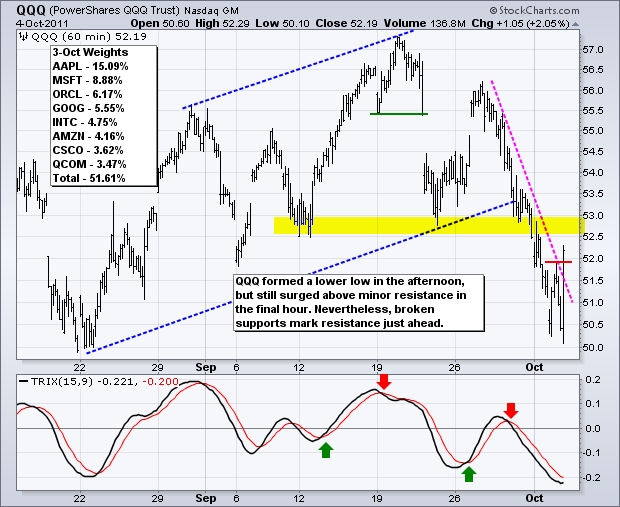
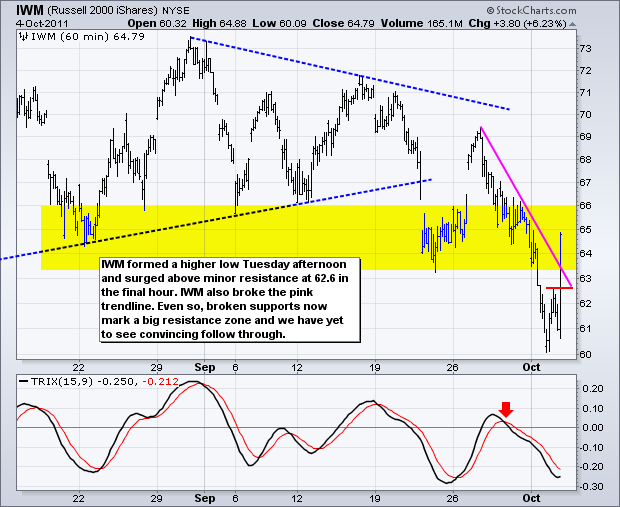
There it is again. Stocks were down sharply in afternoon trading and then mounted a spectacular advance in the final 50 minutes. Press reports attributed this turnaround to an article in the FT. According to the FT, European finance ministers were considering another package to save European banks. Yes, Europe will finally be saved and we can all turn bullish again (written with sarcastic tone). While this does nothing to the medium-term or long-term downtrend, these dramatic turnarounds are producing very quick short-term trend reversals. Moreover, these reversals are only lasting a few days. The chart below shows the Russell 2000 ETF (IWM) with 11 swings of six percent or more since August 9th. That is 11 swings in eight weeks or 1.375 swings per week. Also note that this is the second time in two weeks that the ETF has swung from a 5+ percent loss to a 5+ percent gain. The indicator window shows the Rate-of-Change bottoming below -5% on 22-Sept and surging above +5% a few days later. The same thing happened yesterday. This is better than El Toro at Six Flags.
**************************************************************************
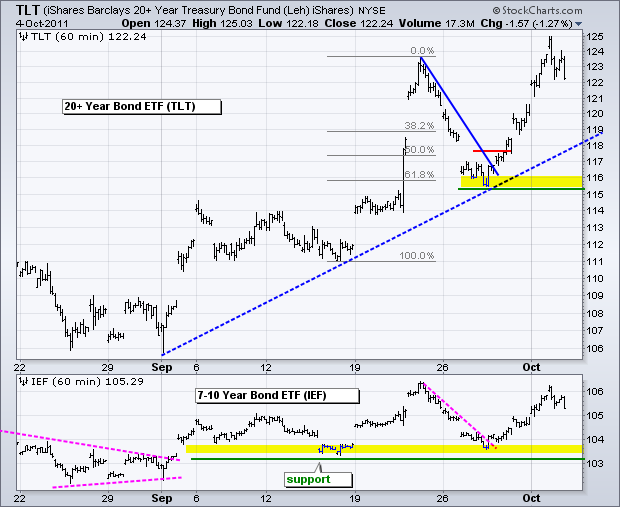
The 20+ year Bond ETF (TLT) pulled back as the stock market surged, but remained above its noon low (122). Even though the ETF is in a clear uptrend, it is overbought after a surge from 115.5 to 125 in a week. It is time to let the market settle down and wait for the next setup to emerge.
**************************************************************************
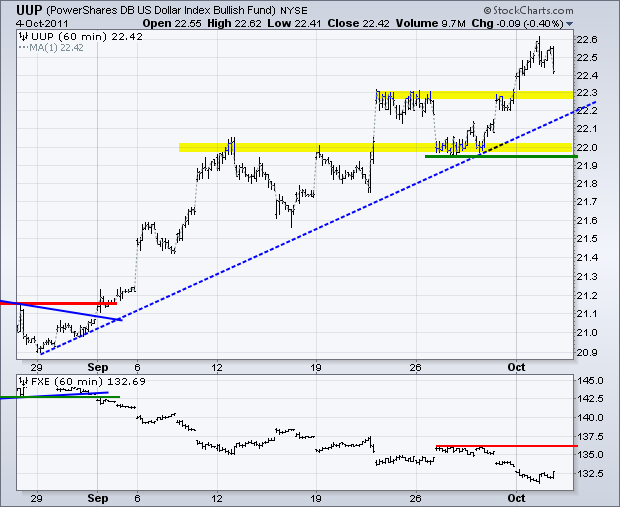
The US Dollar Fund (UUP) also pulled back as stocks surged. Like TLT, the Dollar remains in a bigger uptrend with no signs of real weakness. Broken resistance turns into the first support zone in the 22.30 area. Key support remains in the 22 area. As with TLT, it is time to let the market settle down and the next setup to emerge.
**************************************************************************
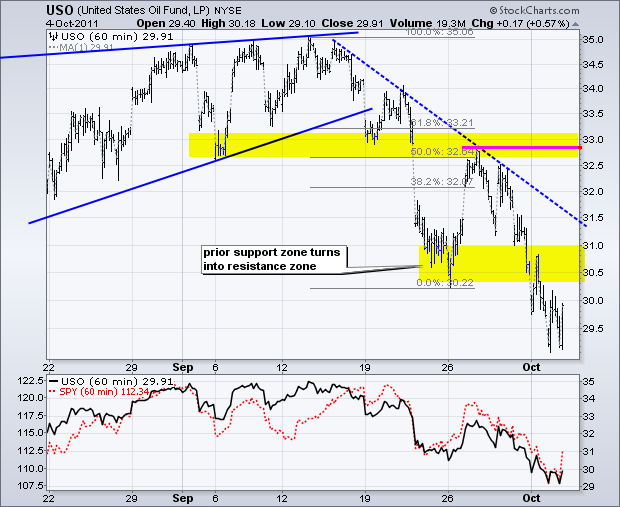
The US Oil Fund (USO) surged in the final hour, but also remains in a bigger downtrend. The prior support zone around 30.5-31 turns into the first resistance zone to watch. Oil will likely take its cues from the Euro and stock market.
**************************************************************************
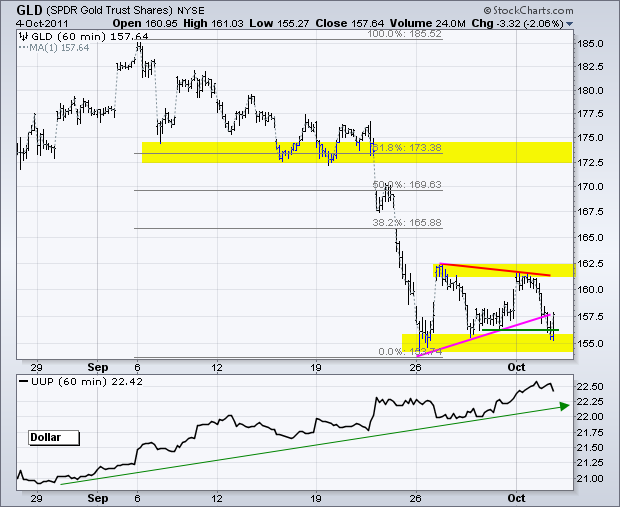
The Gold SPDR (GLD) failed to take out last week's high and moved back to its prior lows. A triangle has taken shape and the ETF broke below the lower trendline yesterday afternoon. However, this break did not hold long as GLD surged right back above 157.50 by the close. Overall, there is a support zone in the 154-156 area and a resistance zone in 161.5-162.5 area. This is still bottom picking territory for gold, but strength in the Dollar could continue to weigh on the yellow metal.
**************************************************************************
Key Economic Reports:
Wed - Oct 05 - 07:00 - MBA Mortgage Index
Wed - Oct 05 - 07:30 - Challenger Job Cuts
Wed - Oct 05 - 08:15 - ADP Employment Change
Wed - Oct 05 - 10:00 - ISM Services Index
Wed - Oct 05 - 10:30 - Oil Inventories
Thu - Oct 06 - 09:30 – European Central Bank (ECB) Policy Statement
Thu - Oct 06 - 08:30 - Jobless Claims
Fri - Oct 07 - 08:30 - Employment Reprot
Fri - Oct 07 - 15:00 - Consumer Credit
Charts of Interest: Tuesday and Thursday in separate post.
This commentary and charts-of-interest are designed to stimulate thinking. This analysis is not a recommendation to buy, sell, hold or sell short any security (stock ETF or otherwise). We all need to think for ourselves when it comes to trading our own accounts. First, it is the only way to really learn. Second, we are the only ones responsible for our decisions. Think of these charts as food for further analysis. Before making a trade, it is important to have a plan. Plan the trade and trade the plan. Among other things, this includes setting a trigger level, a target area and a stop-loss level. It is also important to plan for three possible price movements: advance, decline or sideways. Have a plan for all three scenarios BEFORE making the trade. Consider possible holding times. And finally, look at overall market conditions and sector/industry performance.

