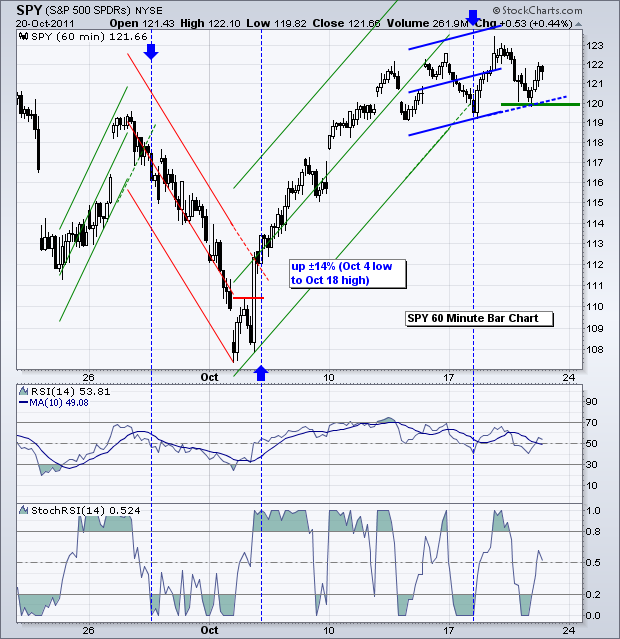
Short-term trading remains choppy as stocks bounce within a range. Playing the swings within this range is not suited for 60-minute charts. Chartists wishing to play these swings should turn to 10 or 15 minute charts. Thursday's SPY chart showed the swings within the trading range (119-123). It is certainly possible to trade this range. Aggressive traders can look for reversals near support and resistance using 10-minute charts. After a downswing from late Wednesday to early Thursday, SPY turned up in the afternoon to trigger a new upswing. I am removing these small swings because they are cluttering the chart and to focus on the zigzag advance since the October 13th low. The big upswing reversed after Monday's break below the green Raff Regression Channel extension (120) and RSI break below 50. However, this reversal did not hold as SPY surged to a new closing high the very next day. Overall, SPY has a series of higher highs and higher lows working the last six days. There is also a rising Raff Regression Channel based on the closing low and high of this range. This blue channel extension marks support around 120 and this level is confirmed by the Thursday afternoon low. Risk remains very high because we could see a big gap on Monday or a strong move Monday or Tuesday. Yes, there is another EU summit this weekend. There will likely be some announcement, but we have no idea if this plan will have enough firepower, details or teeth. The Merkel-Sarkozy trend suggests another grandiose announcement with few details. Here is a quote from Bloomberg: Euro-area brinkmanship indicates a "risk that the post-summit announcements will suggest an ambitious program at a high level but lack concrete detail on implementation," said Huw Pill, London-based chief European economist at Goldman Sachs Group Inc.
**************************************************************************
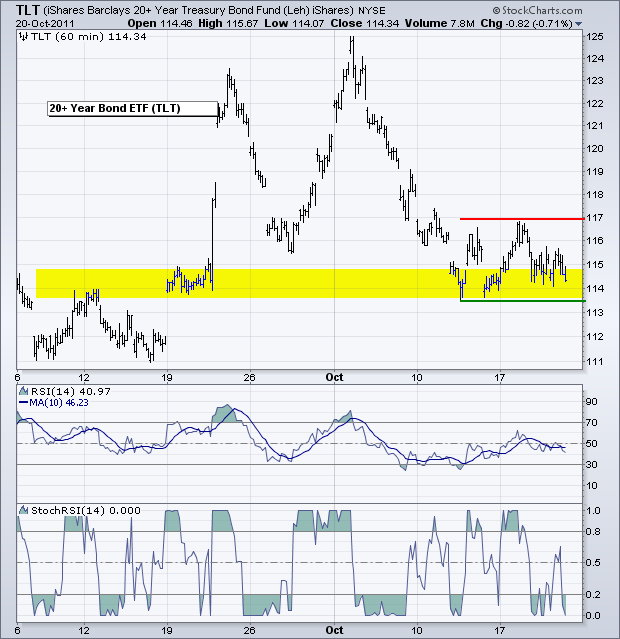
There is no change in the 20+ year Bond ETF (TLT). TLT hit support in the 114 area on October 12th and moved into a trading range. Support is set at 113.5 and resistance at 117. A break from this range will provide the next directional signal. Treasuries will likely take their cue from stocks and the Euro. Weakness in these two would trigger a breakout, while further strength would continue the short-term downtrend.
**************************************************************************
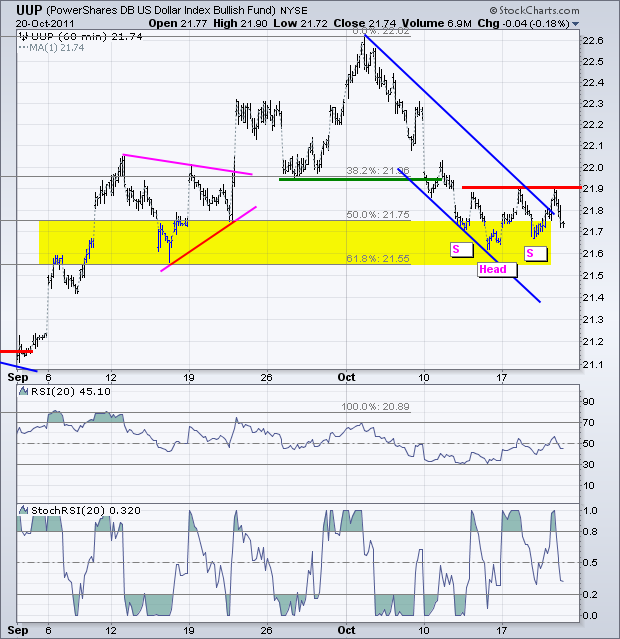
Except for the channel trendline break, there is no change in the US Dollar Fund (UUP). UUP continues to firm in the 50-61.80% retracement zone, but remains in a downtrend since early October. It is possible that a small inverse Head-and-Shoulders pattern is taking shape with resistance around 21.90.
**************************************************************************
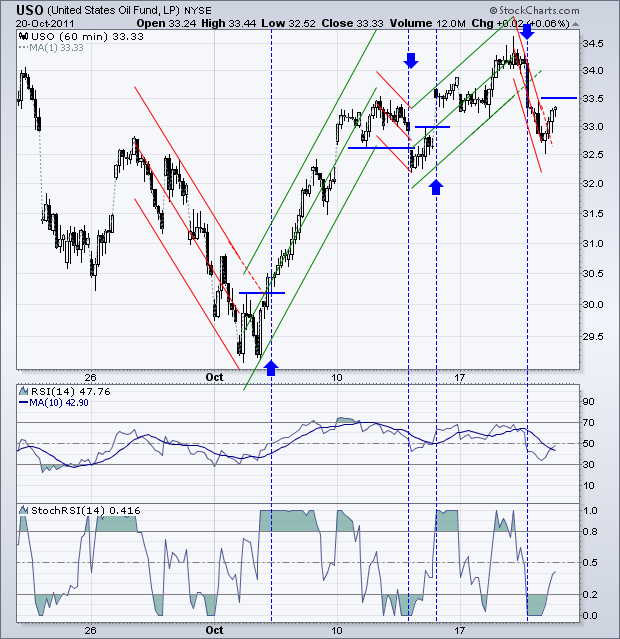
The US Oil Fund (USO) broke above the Raff Regression Channel extension, but RSI has yet to move above 50 for confirmation. Admittedly this channel is too tight and too steep for a 60-minute chart. The move belongs on a shorter chart (10 or 15 minute). Follow through above 33.50 in USO and above 50 in RSI would fully reverse the current downswing.
**************************************************************************
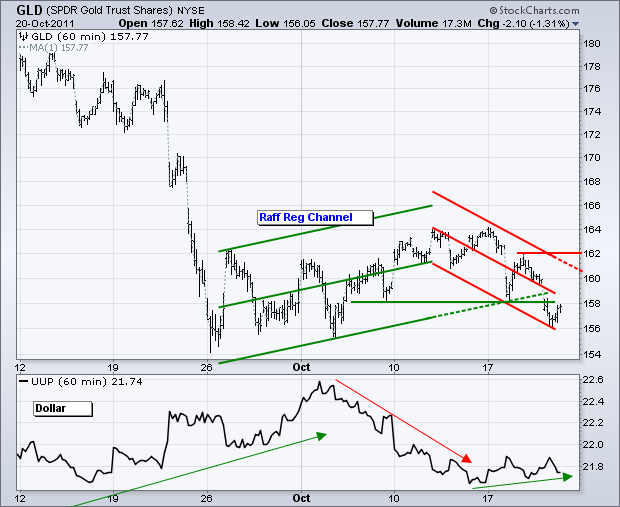
A little firmness in the Dollar weighed on gold over the last few days. The Gold SPDR (GLD) broke the Raff Regression Channel extension with a move below 158. This channel acts as a rising flag on the daily chart and the move signals a continuation lower. A new channel was drawn and resistance is set at 162.
**************************************************************************
Key Economic Reports:
Sun - Oct 23 – 23:59 – G20 Deadline for EU Leaders!
Charts of Interest: Tuesday and Thursday in separate post.
This commentary and charts-of-interest are designed to stimulate thinking. This analysis is not a recommendation to buy, sell, hold or sell short any security (stock ETF or otherwise). We all need to think for ourselves when it comes to trading our own accounts. First, it is the only way to really learn. Second, we are the only ones responsible for our decisions. Think of these charts as food for further analysis. Before making a trade, it is important to have a plan. Plan the trade and trade the plan. Among other things, this includes setting a trigger level, a target area and a stop-loss level. It is also important to plan for three possible price movements: advance, decline or sideways. Have a plan for all three scenarios BEFORE making the trade. Consider possible holding times. And finally, look at overall market conditions and sector/industry performance.

