It is getting close to crunch time for the EU. How many times have we heard this before? Anyhow, yet another deadline is approaching and there are still rifts between Germany and France on the size, scope and leverage for the bailout fund. Stocks extended their advances on Monday with big moves. The Dollar moved lower, while oil, gold and the Euro moved higher. Treasuries were the odd man out on Monday. Even though most of the market was clearly in risk-on mode, Treasuries were only down slightly and actually held up pretty good considering. Perhaps some traders are taking out a little insurance ahead of the EU announcement.
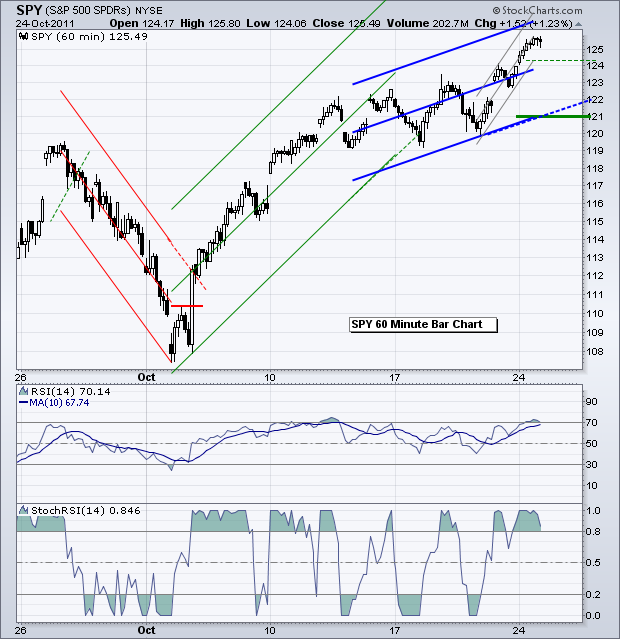
The S&P 500 ETF (SPY) extended its upswing with a move above 125. The ETF is now up around 5 points (4%) since Thursday noon. The gray Raff Regression Channel shows the current upswing within the bigger rising channel. A move below 124.40 would reverse this smaller upswing. The blue Raff Regression Channel defines the bigger upswing. A move below 121 would reverse this upswing. RSI moved above 70. While this is traditionally thought of as overbought, I simply consider RSI bullish above 50 and bearish below 50.
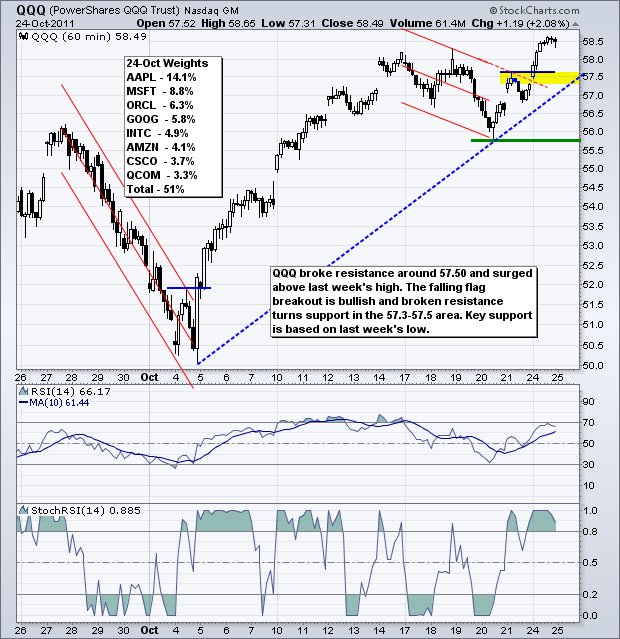
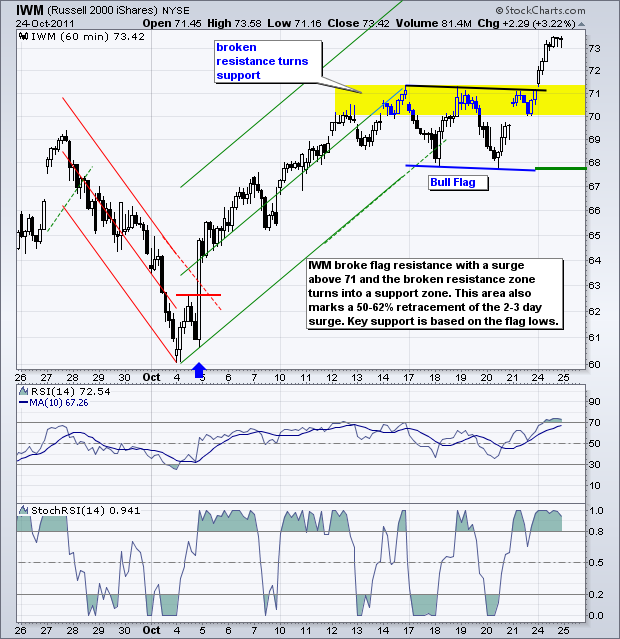
As with IWM above, many stocks and ETFs broke consolidation resistance levels over the last two days. In particular, a number of falling flags, flat flags and pennants formed and the two day surge broke resistance from these patterns. Technically speaking, this signals a continuation of the early October advance. Practically speaking, many of these securities are already well past their breakout points and the risk-reward ratio for new longs is not so good. Keep the risk-reward ratio in mind when considering a trade. Plan your trade ahead of time (entry, stop, exit) and trade your plan.
**************************************************************************
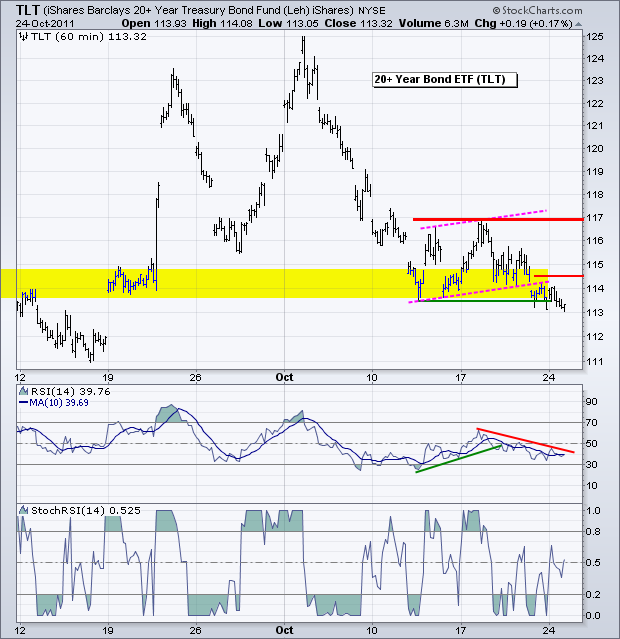
The 20+ year Bond ETF (TLT) broke below rising flag support last week, but then firmed the last two days. TLT has been firming since October 12th, which when it first reached the 113-114 zone. Even though the overall trend is down, I am watching this one closely. A surge above 114.50 in TLT and above 50 in RSI would provide the first bullish sign. Key resistance remains at 117 and it would take a break above this level to fully reverse the downtrend.
**************************************************************************
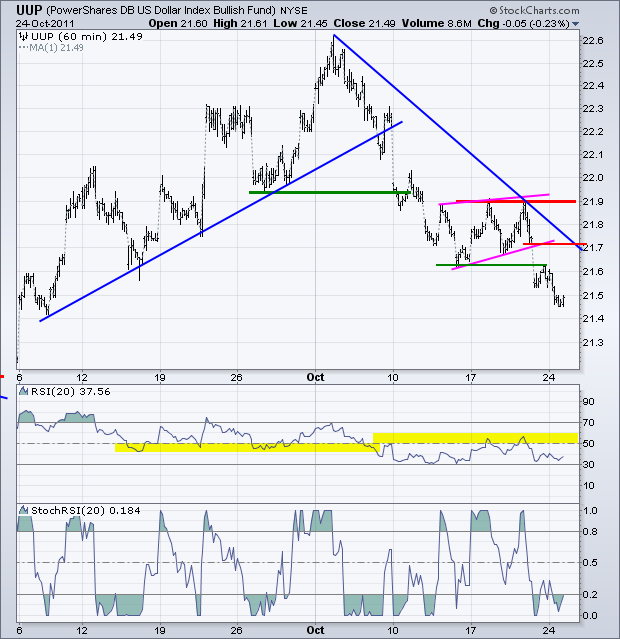
The US Dollar Fund (UUP) remains in a downtrend with a new low for the move on Monday. Broken support and the early October trendline mark first resistance at 21.72. RSI resistance is set at 60. A move above these levels would provide the first bullish clues for the greenback. Key resistance remains at 21.90.
**************************************************************************
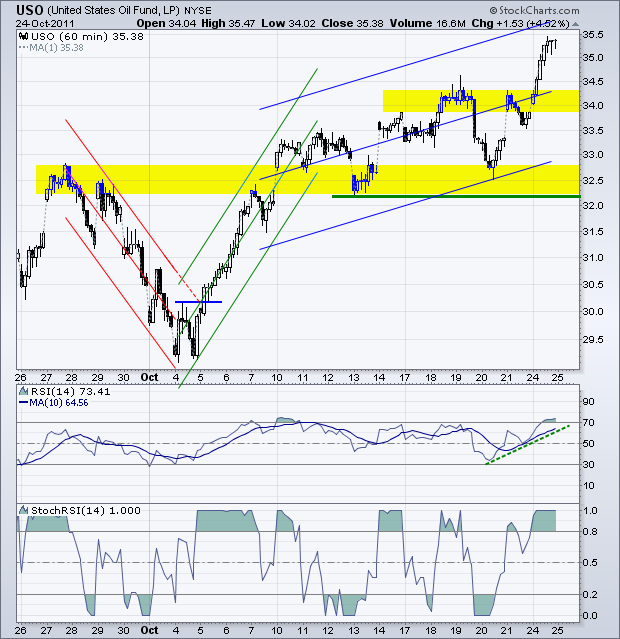
The US Oil Fund (USO) took the risk-on trade rather seriously on Monday with a surge above 35. Nothing but uptrend here with rising troughs and rising peaks. The October lows mark key support in the 32.50 area. Broken resistance turns into the first support zone in the 34 area.
**************************************************************************
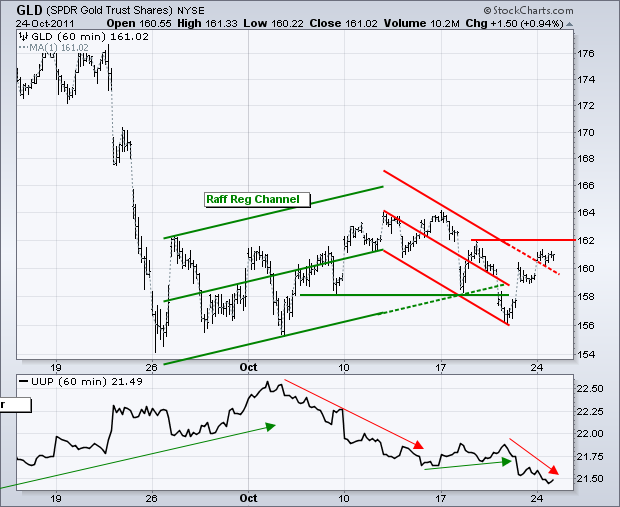
The Dollar fell for three days and the Gold SPDR (GLD) rose from 156 to 161. The move broke above the Raff Regression Channel extension, but remains just short of a resistance breakout at 162. Gold has been one choppy mess since the August plunge. Notice that GLD crossed the 160 level at least 10 times in the last four weeks.
**************************************************************************
Key Economic Reports:
Tue - Oct 25 - 09:00 - Case-Shiller 20-city Index
Tue - Oct 25 - 10:00 - Consumer Confidence
Tue - Oct 25 - 10:00 - FHFA Housing Price Index
Wed - Oct 26 - 07:00 - MBA Mortgage Index
Wed - Oct 26 - 08:30 - Durable Orders
Wed - Oct 26 - 10:00 - New Home Sales
Wed - Oct 26 - 10:30 - Oil Inventories
Wed - Oct 26 - 10:30 - EU Summit II
Thu - Oct 27 - 08:30 - Jobless Claims
Thu - Oct 27 - 08:30 - Advance GDP Q3
Thu - Oct 27 - 10:00 - Pending Home Sales
Fri - Oct 28 - 08:30 - Personal Income/Spending
Fri - Oct 28 - 09:55 - Michigan Sentiment
Charts of Interest: Tuesday and Thursday in separate post.
This commentary and charts-of-interest are designed to stimulate thinking. This analysis is not a recommendation to buy, sell, hold or sell short any security (stock ETF or otherwise). We all need to think for ourselves when it comes to trading our own accounts. First, it is the only way to really learn. Second, we are the only ones responsible for our decisions. Think of these charts as food for further analysis. Before making a trade, it is important to have a plan. Plan the trade and trade the plan. Among other things, this includes setting a trigger level, a target area and a stop-loss level. It is also important to plan for three possible price movements: advance, decline or sideways. Have a plan for all three scenarios BEFORE making the trade. Consider possible holding times. And finally, look at overall market conditions and sector/industry performance.

