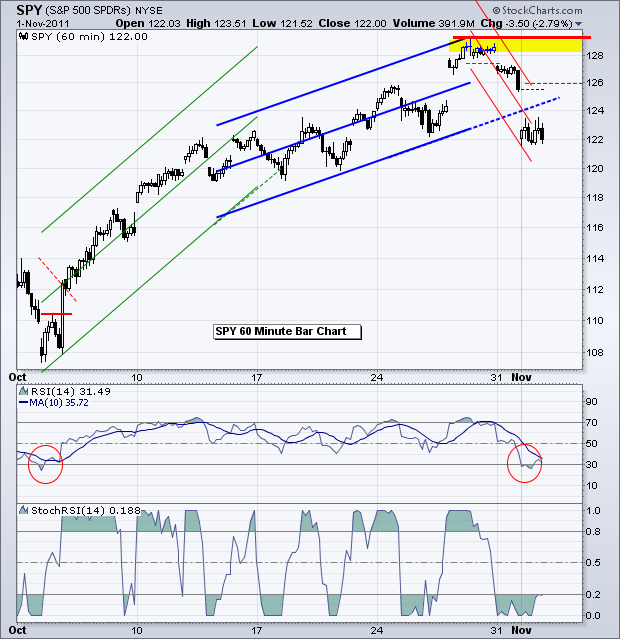
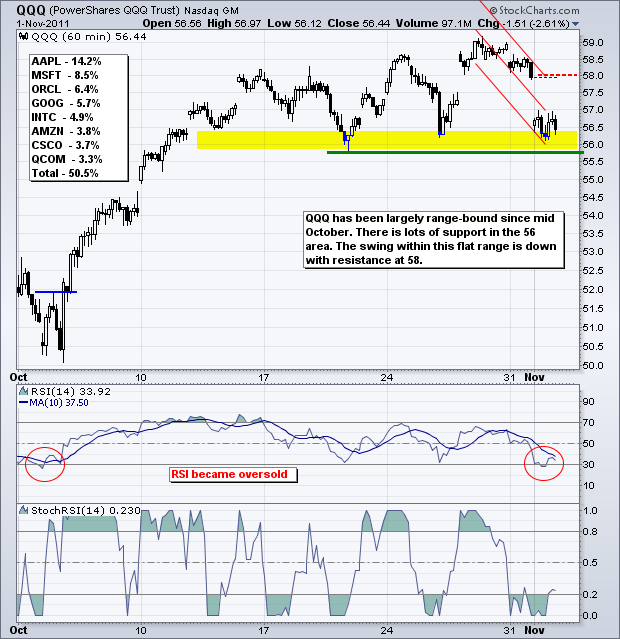
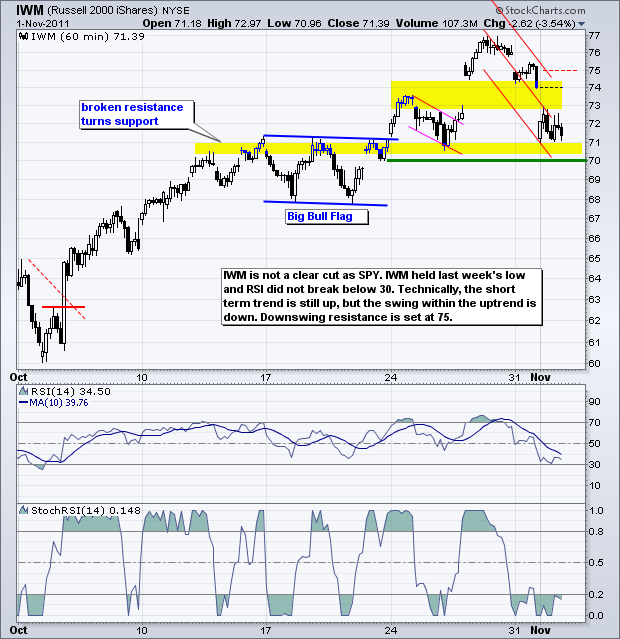
A couple of wrenches, which were thrown out of left field, landed in the flywheel on Monday and Tuesday. While I am not sure the MF Global debacle and Greek referendum are totally to blame for the two day meltdown, there is no questioning the extent of recent selling pressure. Stocks were priced to perfection after the October surge. Recent imperfections warranted a re-pricing as stocks moved sharply lower. IWM failed at its 200-day moving average. SPY moved back into its broken resistance zone (122-124). QQQ is testing the mid October lows. Short-term, these three ETFs are oversold and already near potential support levels. Trading could remain chaotic because we have an FOMC announcement tomorrow and employment report on Friday. Who knows what the next surprise out of Euroland will be? Volatility is the only thing we can be sure of the next three days.
The S&P 500 ETF (SPY) gapped down twice and both gaps held. Also note that the ETF failed to hold Thursday's gap up. The combination of a failed gap up and two successful down gaps is bearish. SPY broke the Raff Regression Channel extension with the second gap and exceeded last week's low. At this point, I am inclined to call the short-term trend down. First resistance is set at 126, which is marked by the end of the short Raff Regression Channel. Last week's highs mark key resistance for now. In the indicator window, RSI moved below 30 for the first time since early October. Even though this suggests that the ETF is short-term oversold, it also indicates that a short-term downtrend has begun. Oversold readings occur in downtrends. Overbought readings occur in uptrends. At this point, traders can consider using StochRSI to identify short-term overbought situations and potential turning points. This indicator is much more sensitive than RSI. A move above .80 would indicate a short-term overbought condition. A subsequent move back below .80 would suggest that the downtrend was resuming.
**************************************************************************
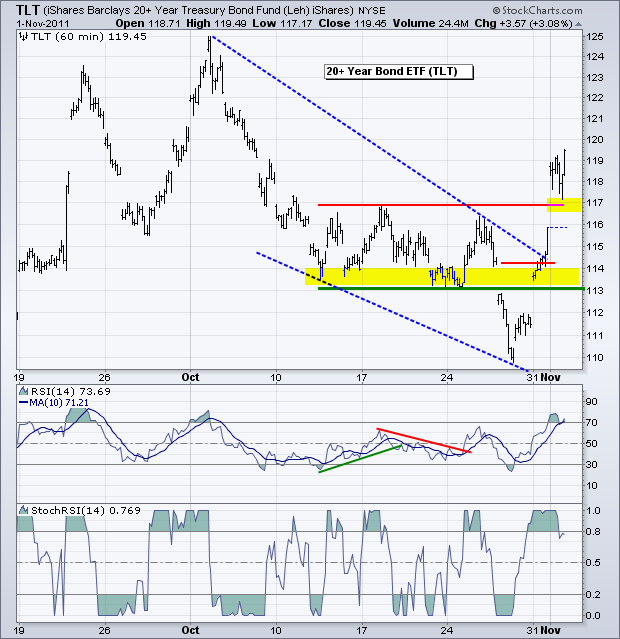
The 20+ year Bond ETF (TLT) extended its surge as the risk-off trade carried over to Tuesday. TLT broke resistance to fully reverse the short-term downtrend. Marking support is tricky at this stage. Broken resistance around 117 turns into potential support. There is also support in the 113 area from the mid October lows. The indicator window shows RSI moving to overbought levels for the first time since early October.
**************************************************************************
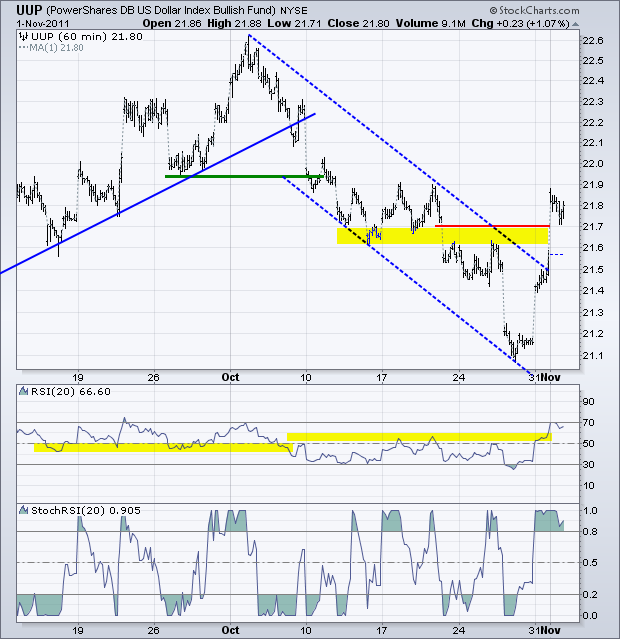
The US Dollar Fund (UUP) followed Treasuries higher again and broke resistance at 21.70. Even though the mid October consolidation may offer more resistance near current levels, this breakout surge has reversed the short-term downtrend. Marking new support is difficult after this surge so I will wait a day or two. RSI broke above the 50-60 resistance zone and also hit 70 for the first time since early October. The 40-50 zone now becomes support.
**************************************************************************
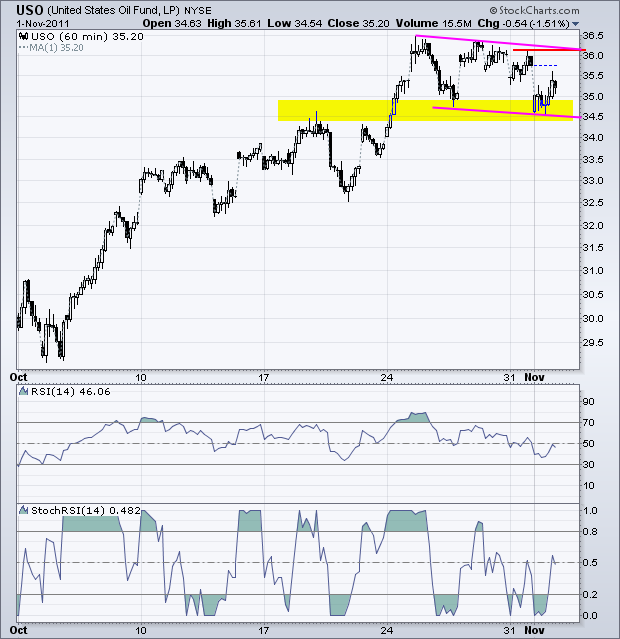
The US Oil Fund (USO) continues to hold up relatively well. However, I think the short-term trend is down with a lower high late last week and a lower low today. It is possible that a falling flag is taking shape with resistance just above 36. Look for a break above this level to revive the uptrend. I expect oil to take its cue from stocks and the Dollar.
**************************************************************************
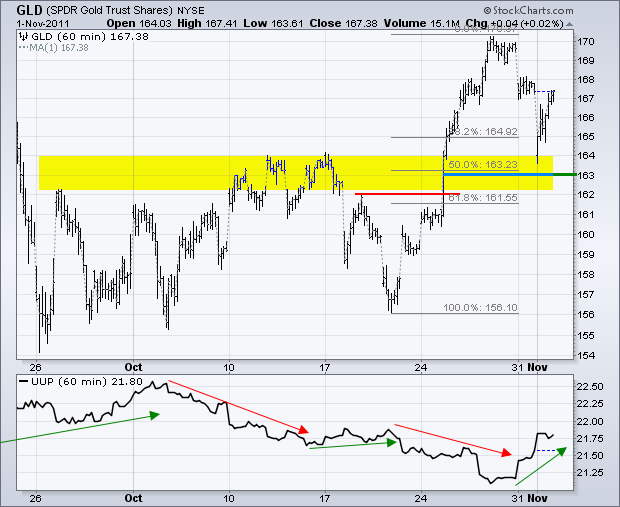
After a sharply lower open, the Gold SPDR (GLD) divorced itself from the Dollar and moved back above 167 for a strong close. This is impressive considering the surge in the Dollar. Also notice that GLD found support in the 162-164 zone, which stems from broken resistance. The breakout held and gold remains in bull mode. With this bounce, I will set key support at 163.
**************************************************************************
Key Economic Reports:
Wed - Nov 02 - 07:00 - MBA Mortgage Index
Wed - Nov 02 - 07:30 - Challenger Job Cuts
Wed - Nov 02 - 08:15 - ADP Employment Change
Wed - Nov 02 - 10:30 - Oil Inventories
Wed - Nov 02 - 12:30 - FOMC Rate Decision
Thu - Nov 03 - 08:30 - Jobless Claims
Thu - Nov 03 - 10:00 - Factory Orders
Thu - Nov 03 - 10:00 - ISM Services
Fri - Nov 04 - 08:30 - Employment Report
Charts of Interest: Tuesday and Thursday in separate post.
This commentary and charts-of-interest are designed to stimulate thinking. This analysis is not a recommendation to buy, sell, hold or sell short any security (stock ETF or otherwise). We all need to think for ourselves when it comes to trading our own accounts. First, it is the only way to really learn. Second, we are the only ones responsible for our decisions. Think of these charts as food for further analysis. Before making a trade, it is important to have a plan. Plan the trade and trade the plan. Among other things, this includes setting a trigger level, a target area and a stop-loss level. It is also important to plan for three possible price movements: advance, decline or sideways. Have a plan for all three scenarios BEFORE making the trade. Consider possible holding times. And finally, look at overall market conditions and sector/industry performance.


