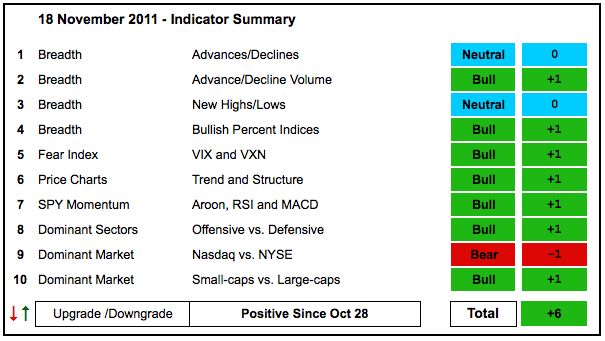
Even though there is no change in the indicator summary, it would not take much to tilt the balance back to the bears. With this week's sharp decline, the major index ETFs are on the verge of support breaks that would question the October breakouts. Support breaks in the major index ETFs would also lead to many Double Top Breakdowns on the P&F charts of the component stocks, which would lead to weakness in the Bullish Percent Indices. The AD Volume Lines are also testing their October breakouts. The volatility indices are challenging resistance and another push higher would signal a breakout in fear. In short, another sharp decline or down week would be enough to turn this indicator summary negative.
- AD Lines: Neutral. The Nasdaq AD Line never broke resistance from the mid August high and remains bearish. The NYSE AD Line fell short of its summer high, but remains in an uptrend and has yet to break the early November low.
- AD Volume Lines: Bullish. The NYSE and Nasdaq AD Volume Lines both broke resistance with the October surges and broken resistance turns support. Both moved sharply lower this week. Further weakness would break support to signal a failed breakout and turn these indicators bearish again. As you can see, I am not giving these breakouts much breathing room. Either they hold or they fold.
- Net New Highs: Neutral. Net New Highs turned negative on the Nasdaq in November and this pushed the Cumulative Net New Highs Line below its 10-day EMA. NYSE Net New Highs remain positive and the Cumulative Net New Highs Line is above its 10-day EMA.
- Bullish Percent Indices: Bullish. Eight of the nine sector Bullish Percent Indices are above 50%. Only the Materials Bullish% Index ($BPMATE) is below 50%.
- VIX/VXN: Bullish. The CBOE Volatility Index ($VIX) and the Nasdaq 100 Volatility Index ($VXN) failed to stay below 30, which is not a good sign. Both are now pushing resistance in the 37-38 area. Breakouts would signal a rise in fear that would be bearish for stocks.
- Trend Structure: Bullish. DIA, MDY and IWM are holding above their November 1st lows and 50-day SMAs. QQQ broke both and SPY is close to a break. Three of the five are still holding on and it is too early to turn bearish on this indicator.
- SPY Momentum: Bullish. RSI dipped below 50, but needs to break 40 to turn fully bearish. MACD(5,35,5) moved below its signal line, but has yet to turn negative. Aroon(25) remains in positive territory and needs to reach -50 to turn bearish.
- Offensive Sector Performance: Bullish. The Finance SPDR (XLF) broke down to lead lower this week. The Consumer Discretionary SPDR (XLY) is on the verge of a break down. The Industrials SPDR (XLI) and Technology SPDR (XLK) are still holding up, but breaks below their 50-day SMAs would be bearish.
- Nasdaq Performance: Bearish. The $COMPQ:$NYA ratio peaked in late September and moved lower the last 2-3 months. The Nasdaq is underperforming the NY Composite ($NYA).
- Small-cap Performance: Bullish. The $RUT:$OEX ratio surged back to its late August highs as small-caps led the market higher in October. I will turn bearish on this indicator if the ratio breaks below 1.30.
- Breadth Charts (here) and Inter-market charts (here) have been updated.
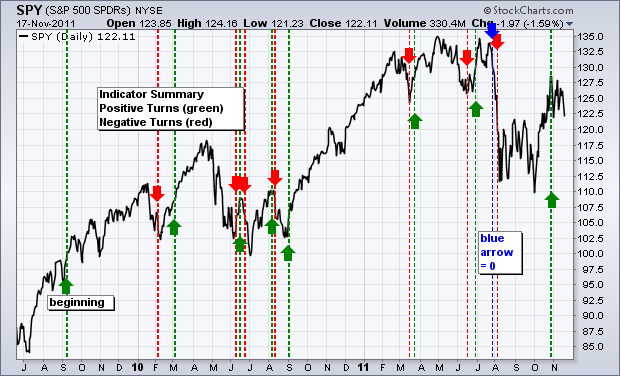
This table is designed to offer an objective look at current market conditions. It does not aim to pick tops or bottoms. Instead, it seeks to identify noticeable shifts in buying and selling pressure. With 10 indicator groups, the medium-term evidence is unlikely to change drastically overnight.
Previous turns include:
Positive on 11-Sept-09
Negative on 5-Feb-10
Positive on 5-March-10
Negative on 11-Jun-10
Positive on 18-Jun-10
Negative on 24-Jun-10
Positive on 6-Aug-10
Negative on 13-Aug-10
Positive on 3-Sep-10
Negative on 18-Mar-11
Positive on 25-Mar-11
Negative on 17-Jun-11
Positive on 30-Jun-11
Neutral on 29-Jul-11
Negative on 5-August-11
Positive on 28-October-11


