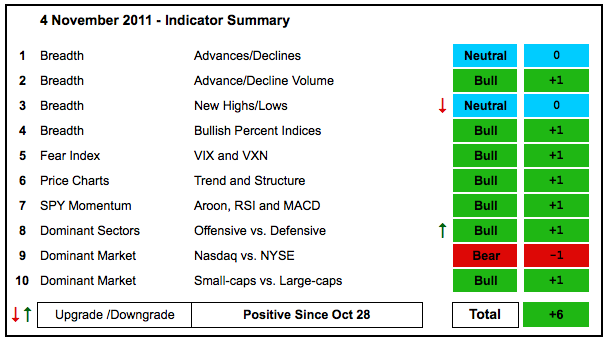
The indicator summary remains positive, but breadth is split with the Nasdaq showing less strength. After some weakness early in the week, stocks rebounded on Wednesday-Thursday and the major index ETFs are largely holding their October breakouts. This selling pressure was enough to push Nasdaq net new highs into negative territory again. It also prevented the Nasdaq AD Line from making a breakout. The Nasdaq is underperforming the NY Composite the last two months. Despite some problems with the Nasdaq, the overall picture remains bullish for stocks. I will be watching this week's lows in the major index ETFs. A sharp decline that breaks these lows would question the validity of the October breakouts.
- AD Lines: Neutral. The Nasdaq AD Line surged to resistance, but did not break its mid August high. No cigar just yet. The NYSE AD Line broke through resistance and is clearly in bull mode.
- AD Volume Lines: Bullish. There is no ambivalence here as both the NYSE and Nasdaq AD Volume Lines broke resistance with massive surges the last few weeks. I am marking support relatively close to make sure these breakouts hold.
- Net New Highs: Neutral. Net New Highs turned negative on the Nasdaq this week and pushed the Cumulative Net New Highs Line below its 10-day EMA. NYSE Net New Highs remained positive and the Cumulative Net New Highs Line is above its 10-day EMA.
- Bullish Percent Indices: Bullish. All nine sector BPIs are above 50% and in bull mode.
- VIX/VXN: Bullish. The CBOE Volatility Index ($VIX) and the Nasdaq 100 Volatility Index ($VXN) both plunged below their September lows and broke support. Despite a bounce this week, the overall trend appears to be down.
- Trend Structure: Bullish. DIA, IWM, MDY, QQQ and SPY all broke above resistance levels with big moves in October. These resistance breakouts were challenged with a pullback early this week, but held with a bounce on Wednesday-Thursday.
- SPY Momentum: Bullish. The momentum indicators are all in bull mode. RSI is rising and above 50. MACD(5,35,5) is in positive territory. Aroon moved above 50.
- Offensive Sector Performance: Bullish. The Consumer Discretionary SPDR (XLY), Industrials SPDR (XLI) and Finance SPDR (XLF) have shown relative strength since October third. The Technology SPDR (XLK) is lagging the broader market.
- Nasdaq Performance: Bearish. The $COMPQ:$NYA ratio formed a lower high in October and broke support with a decline the last two weeks. The Nasdaq is underperforming the NY Composite ($NYA).
- Small-cap Performance: Bullish. The $RUT:$OEX ratio surged back to its late August highs as small-caps led the market higher since early October.
- Breadth Charts (here) and Inter-market charts (here) have been updated.
This table is designed to offer an objective look at current market conditions. It does not aim to pick tops or bottoms. Instead, it seeks to identify noticeable shifts in buying and selling pressure. With 10 indicator groups, the medium-term evidence is unlikely to change drastically overnight.
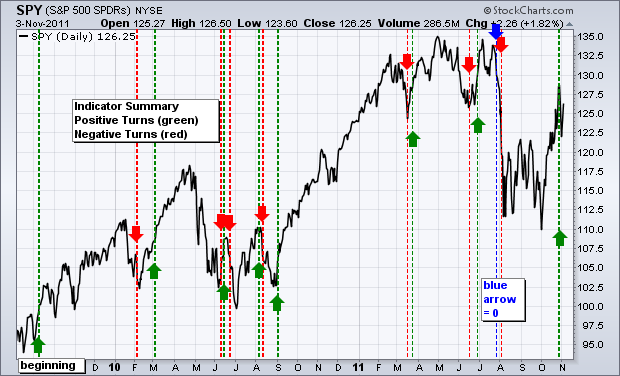
Previous turns include:
Positive on 11-Sept-09
Negative on 5-Feb-10
Positive on 5-March-10
Negative on 11-Jun-10
Positive on 18-Jun-10
Negative on 24-Jun-10
Positive on 6-Aug-10
Negative on 13-Aug-10
Positive on 3-Sep-10
Negative on 18-Mar-11
Positive on 25-Mar-11
Negative on 17-Jun-11
Positive on 30-Jun-11
Neutral on 29-Jul-11
Negative on 5-August-11
Positive on 28-October-11


