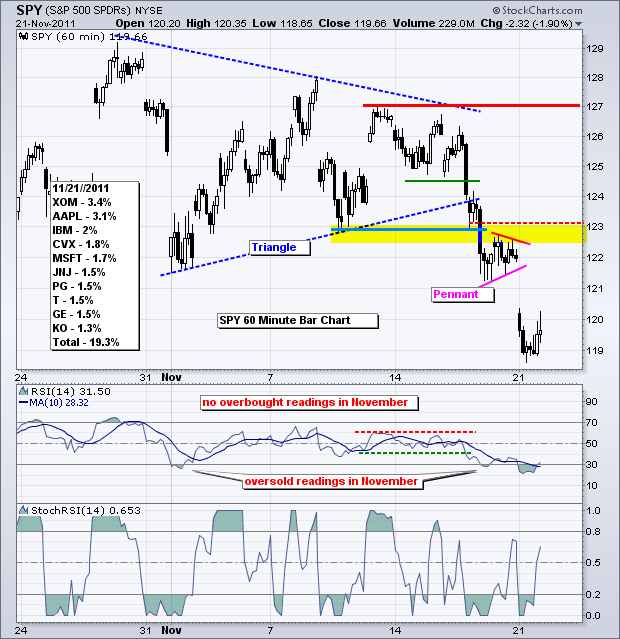
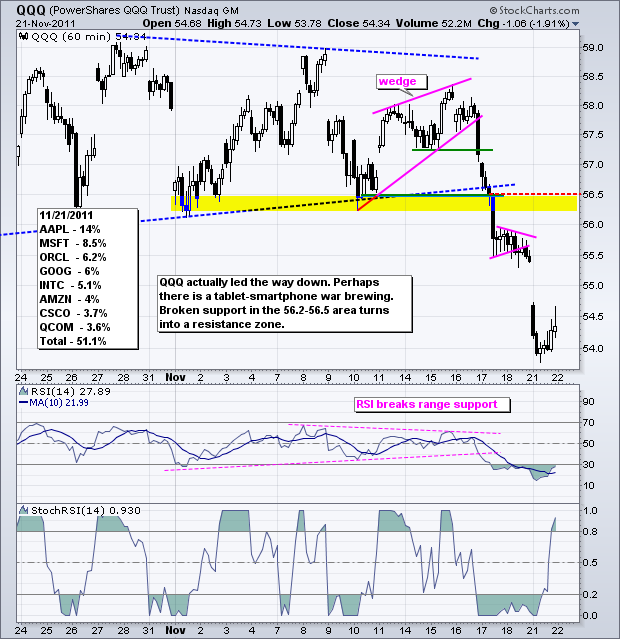
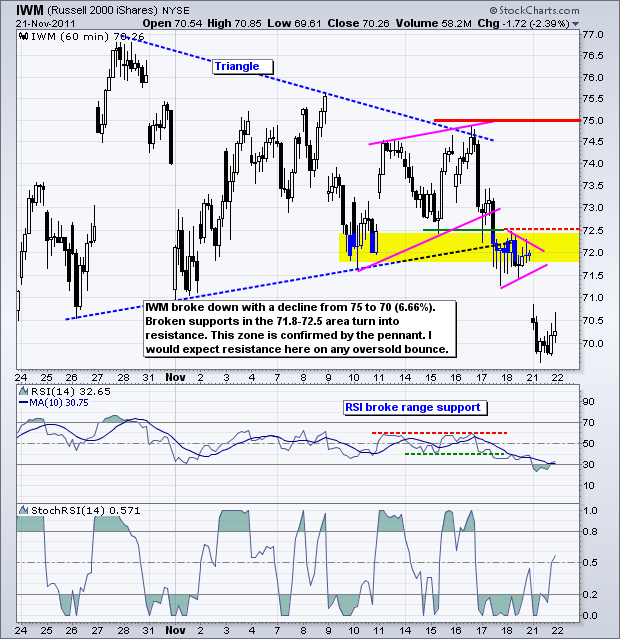
With the major index ETFs down 5-6% in the last six trading days, the market is short-term oversold and this could pave the way for a consolidation or oversold bounce. Trading could also get real tricky as volume dries up for the Thanksgiving holiday and the potential news flow rattles the markets. Europe will not be on holiday so we can expect the usual flow of rumors and innuendo. It may be a good time to start the Thanksgiving holiday early and take a break from trading until Monday. On the price chart, SPY broke down with a decline from 127 to 119 (6.2%). Broken support in the 123 area turns into the first resistance zone. This is confirmed by the pennant highs.
**************************************************************************
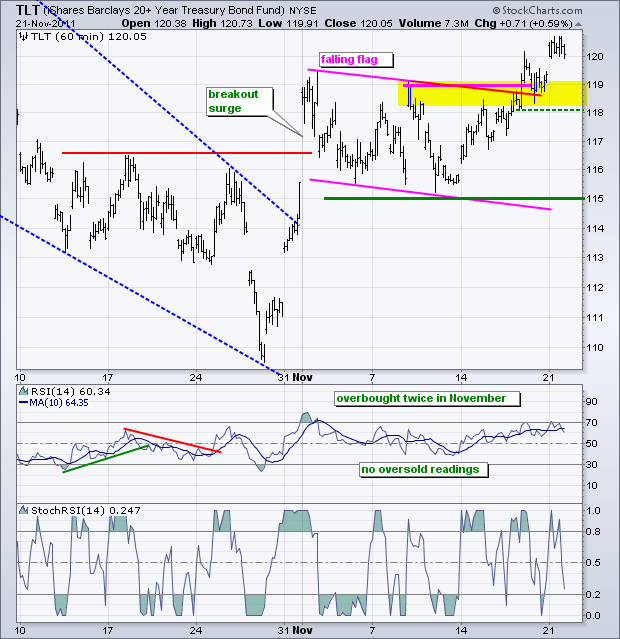
There is no change on the 20+ year Bond ETF (TLT) chart. TLT broke flag resistance with a surge the last six days. TLT is up around 4%, which is a big move that makes Treasuries as overbought as stocks are oversold. Broken resistance in the 118-119 area turns into the first support zone. Key support remains at 115.
**************************************************************************
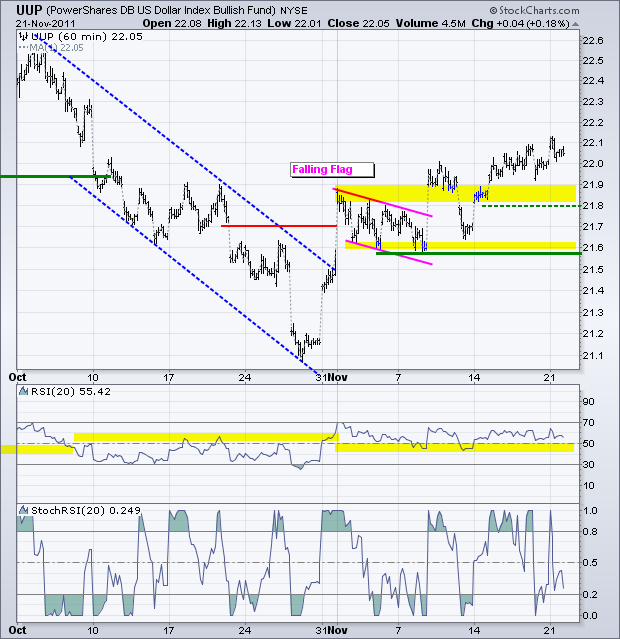
There is no change in the US Dollar Fund (UUP). Even though Monday's advance was rather tame, the overall trend is clearly up. Broken resistance in the 21.8-21.9 area turns into first support. Key support remains in the 21.60 area. RSI support is set at 40.
**************************************************************************
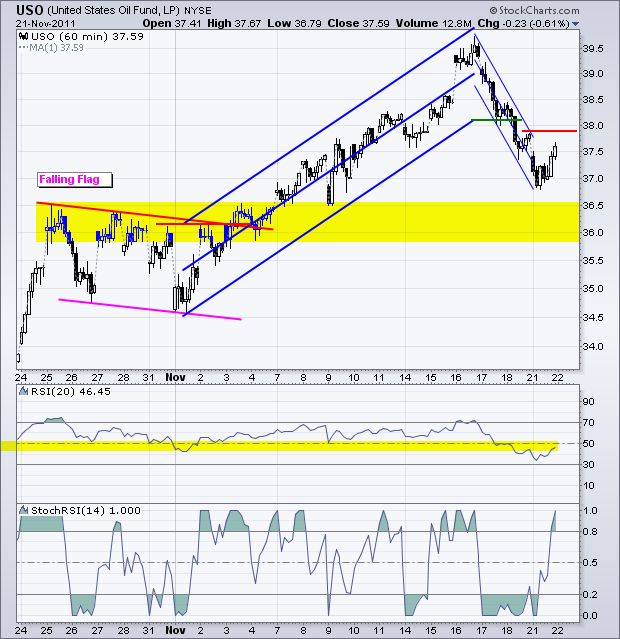
The US Oil Fund (USO) got a pretty nice pop with a move above 37.50 by the close. The swing remains down with first resistance at 37.90. The downswing of the last few days produced a steep falling channel. I am using the Raff Regression Channel to estimate first resistance. An oversold bounce in stocks could produce a bounce in oil.
**************************************************************************
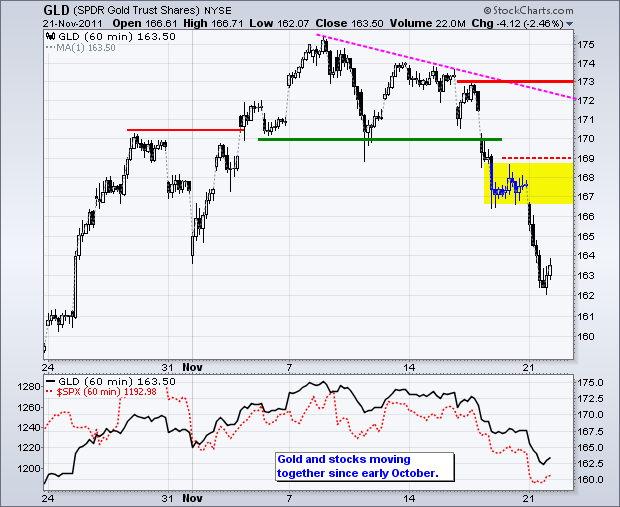
The positive correlation between stocks and gold is remarkable this month. The indicator window shows stocks in red and gold in black. These two are moving step-for-step. The first sign of strength in gold will be when stocks go down and gold holds firm. Until then, weakness in stocks and the Euro is considered bearish for gold. The Gold SPDR (GLD) is oversold after a 5.7% decline the last four days. Friday's consolidation marks the first resistance zone.
**************************************************************************
Key Economic Reports:
Tue - Nov 22 - 08:30 - GDP
Tue - Nov 22 - 14:00 - FOMC Minutes
Wed - Nov 23 - 07:00 - MBA Mortgage Index
Wed - Nov 23 - 08:30 - Initial Claims
Wed - Nov 23 - 08:30 - Personal & Spending
Wed - Nov 23 - 08:30 - Durable Orders
Wed - Nov 23 - 09:55 - Michigan Sentiment
Wed - Nov 23 - 10:30 - Oil Inventories
Thu – Nov 24 – 10:00 – Thanksgiving!!
Charts of Interest: Tuesday and Thursday in separate post.
This commentary and charts-of-interest are designed to stimulate thinking. This analysis is not a recommendation to buy, sell, hold or sell short any security (stock ETF or otherwise). We all need to think for ourselves when it comes to trading our own accounts. First, it is the only way to really learn. Second, we are the only ones responsible for our decisions. Think of these charts as food for further analysis. Before making a trade, it is important to have a plan. Plan the trade and trade the plan. Among other things, this includes setting a trigger level, a target area and a stop-loss level. It is also important to plan for three possible price movements: advance, decline or sideways. Have a plan for all three scenarios BEFORE making the trade. Consider possible holding times. And finally, look at overall market conditions and sector/industry performance.

