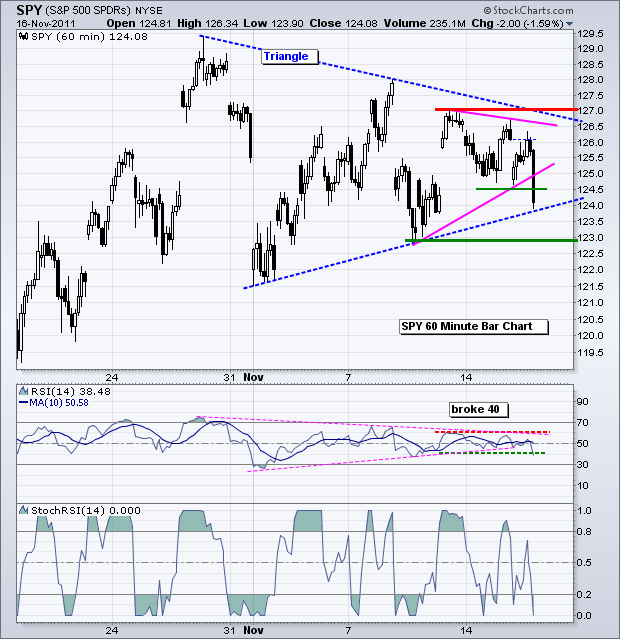
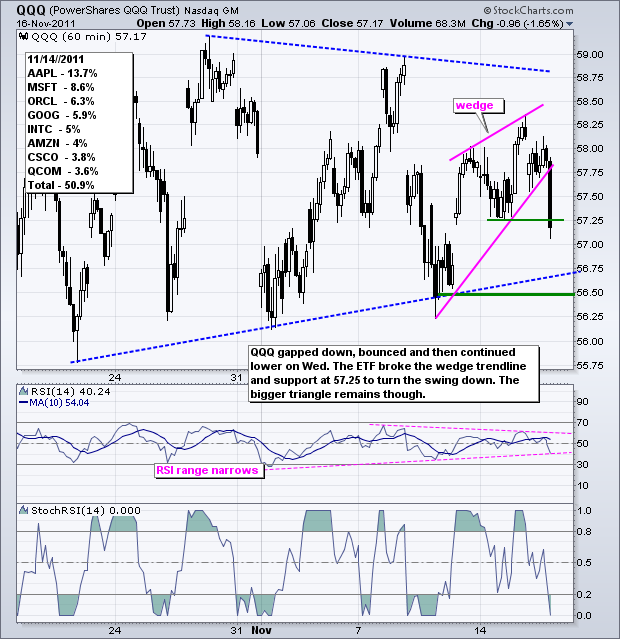
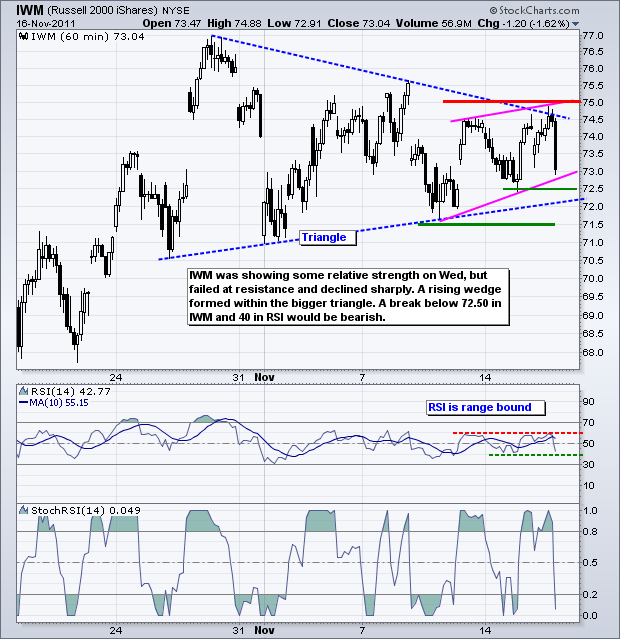
With the US Dollar Fund (UUP) hitting its highest level of the month and the 20+ year Bond ETF (TLT) on the verge of a breakout, it is little wonder stocks finally succumbed to some selling pressure. Also note that $LIBOR continues to rise and the Finance SPDR (XLF) continues to show relative weakness. The S&P 500 ETF (SPY) remains within a larger triangle formation, but broke short-term support with a sharp decline in the final hour on Wednesday. Of course, this decline was triggered by some negative comments regarding Europe. Fitch noted that US banks are at risk because of the problems in Europe. Yes, they used the nine letter word: contagion. There is no shortage of market moving news or events these days. Moreover, there is no shortage of "crucial" moments (Spanish debt auctions, Greek confidence votes, new Italian governments, UK economic warnings, French-German wrangling). It just never ends. We cannot predict the next "surprise" to jolt the market, but we can be pretty sure that there will be more market jolting surprises in the coming days and weeks. Yes, the prospects of whipsaw remain high. Turning back to SPY, the ETF gapped down and formed another lower high on Tuesday. There was a post-gap bounce back to 126, but this failed as the ETF plunged below 124.50 by the close. With this move, RSI broke below 40 and the swing within the triangle has turned down. I will mark key resistance at 127.
**************************************************************************
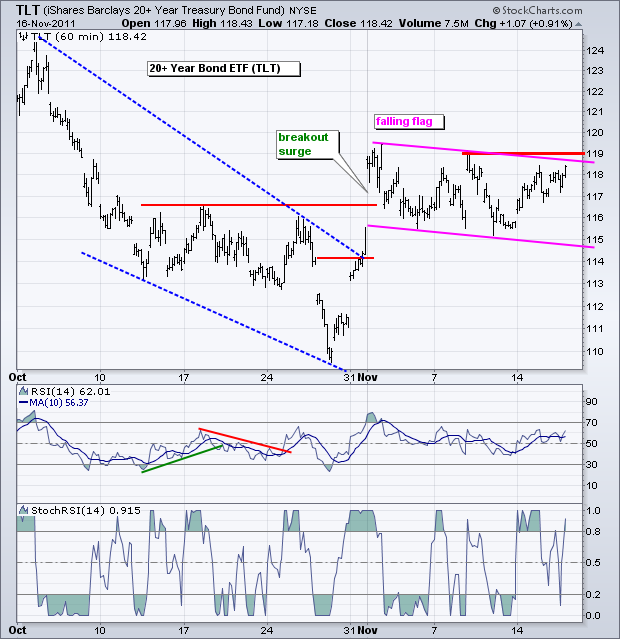
The 20+ year Bond ETF (TLT) bounced off support the last three days to challenge resistance. The overall picture remains unchanged. The bigger trend is up with the surge and breakout. A falling flag took shape after this surge. A break above 119 would signal a continuation higher. A breakout in Treasuries would favor the risk-off trade and be bearish for stocks.
**************************************************************************
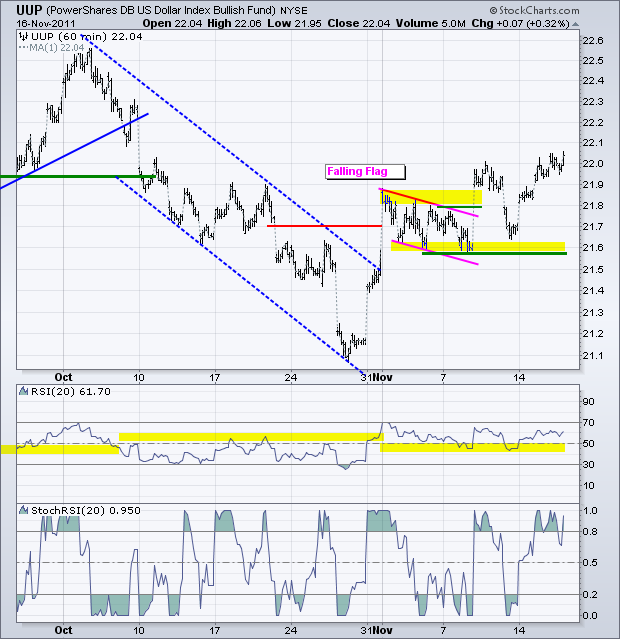
No change. The US Dollar Fund (UUP) reversed its downtrend with a surge-breakout above 21.70, formed a falling flag and then broke flag resistance with a surge last week. Despite a pullback on Friday, the ETF held support and surged back above 22 this week. This surge reinforces support in the 21.60 area. Further strength in the Dollar, which means weakness in the Euro, could weigh on stocks, especially if Treasuries start moving higher too.
**************************************************************************
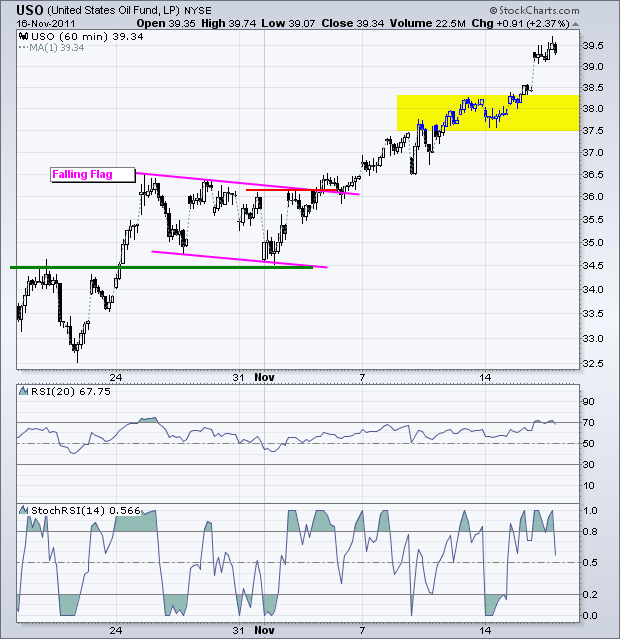
The US Oil Fund (USO) bucked the stock market and the Dollar with a surge above 39 on the open and strong gain for the day. This means Spot Light Crude ($WTIC) is above $100. Something needs to give here. Either oil comes back down to earth or the stock market joins oil with a move higher. I would now mark a support zone in the 37.5-38.25 area.
**************************************************************************
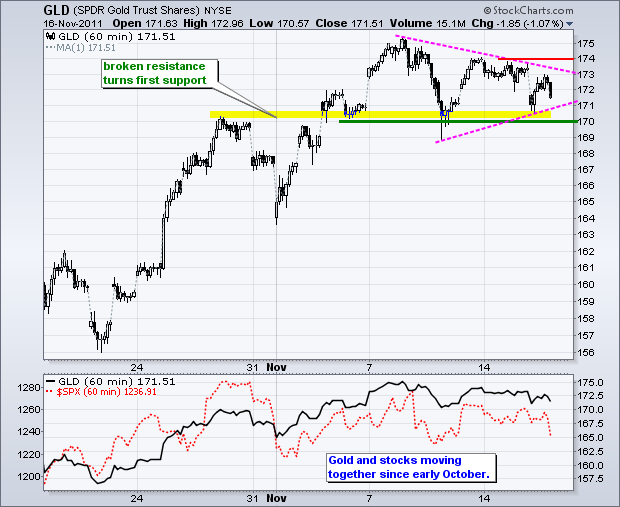
The Gold SPDR (GLD) is still following the stock market, and perhaps the Euro. All three moved lower on Wednesday. The Gold SPDR (GLD) formed a triangle consolidation the last few days with support at 170 and resistance at 174. While a break below 170 would be bearish, I still view gold as the only real currency alternative and wonder how long it would stay down. A move above 174 would break resistance and signal a continuation higher.
**************************************************************************
Key Economic Reports:
Thu - Nov 17 - 08:30 - Jobless Claims
Thu - Nov 17 - 08:30 - Housing Starts/Building Permits
Thu - Nov 17 - 10:00 - Philadelphia Fed
Fri - Nov 18 - 10:00 - Leading Indicators
Charts of Interest: Tuesday and Thursday in separate post.
This commentary and charts-of-interest are designed to stimulate thinking. This analysis is not a recommendation to buy, sell, hold or sell short any security (stock ETF or otherwise). We all need to think for ourselves when it comes to trading our own accounts. First, it is the only way to really learn. Second, we are the only ones responsible for our decisions. Think of these charts as food for further analysis. Before making a trade, it is important to have a plan. Plan the trade and trade the plan. Among other things, this includes setting a trigger level, a target area and a stop-loss level. It is also important to plan for three possible price movements: advance, decline or sideways. Have a plan for all three scenarios BEFORE making the trade. Consider possible holding times. And finally, look at overall market conditions and sector/industry performance.

