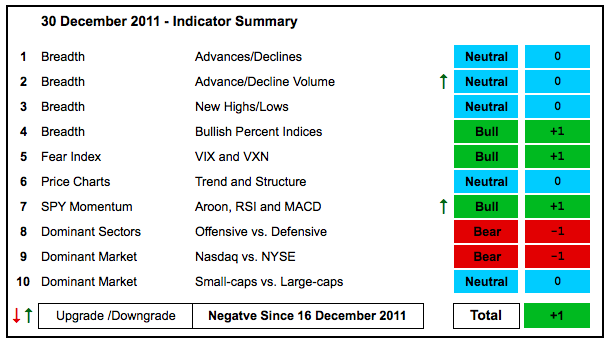
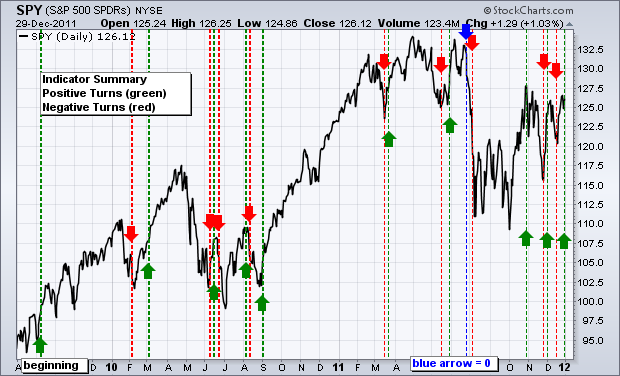
With a couple of upgrades, the indicator summary moved from -2 to +1 this week. The total has been waffling around the zero level for a few weeks now, which reflects a divided the market. The average Nasdaq stock is relatively weak, but the average NYSE stock is relatively strong. The Nasdaq AD Line hit a new low this month, but the NYSE AD Line is challenging its Oct-Nov highs. Nasdaq Net New Highs are weak and largely negative, but NYSE Net New Highs are strong and largely positive. The three defensive sectors are relatively strong with breaks above their October highs, but the four offensive sectors are relatively weak because they have yet to break these highs.
- AD Lines: Neutral. The Nasdaq AD Line hit a new low this month and remains in a strong downtrend. The NYSE AD Line formed a higher low in late November and surged above its early December high.
- AD Volume Lines: Neutral. The Nasdaq AD Volume Line is in a downtrend with a lower high in early December and a lower low in late December. The NYSE AD Volume Line remains below its Oct-Nov highs, but in an uptrend with support at the mid December low.
- Net New Highs: Neutral. Nasdaq Net New Highs remain negative and the Cumulative Net New Highs Line is below its 10-day EMA. NYSE Net New Highs, however, surged above 5% this month and the Cumulative Net New Highs line has been rising since mid October.
- Bullish Percent Indices: Bullish. Seven of the nine BPIs remain above 50%. The energy and materials Bullish Percent Indices are the only two below 50%.
- VIX/VXN: Bullish. The CBOE Volatility Index ($VIX) and the Nasdaq 100 Volatility Index ($VXN) are trending down and both broke below their late October lows this month. Lower volatility is positive for stocks.
- Trend Structure: Neutral. The major index ETFs recovered from the mid November swoons and formed inverse Head-and-Shoulders patterns that extend from late October to now. Breaks above the early December highs would confirm these bullish continuation patterns.
- SPY Momentum: Bullish. RSI is still below 60 (57), but the Aroon Oscillator surged above +50 early this week and MACD(5,35,5) is in positive territory.
- Offensive Sector Performance: Bearish. All three defensive sectors broke above their October highs (consumer staples, utilities, healthcare). All four offensive sectors remain below their October highs (industrials, finance, technology, consumer discretionary).
- Nasdaq Performance: Bearish. The $COMPQ:$NYA ratio moved below its late October low and remains in a downtrend as the Nasdaq continues to underperform the NY Composite.
- Small-cap Performance: Neutral. The $RUT:$OEX ratio surged in October and pulled back in late November. Overall, an inverse Head-and-Shoulders pattern has taken shape since August. A break above the November highs would show serious relative strength returning to small-caps.
- Breadth Charts (here) and Inter-market charts (here) have been updated.
This table is designed to offer an objective look at current market conditions. It does not aim to pick tops or bottoms. Instead, it seeks to identify noticeable shifts in buying and selling pressure. With 10 indicator groups, the medium-term evidence is unlikely to change drastically overnight.
Previous turns include:
Positive on 11-Sept-09
Negative on 5-Feb-10
Positive on 5-March-10
Negative on 11-Jun-10
Positive on 18-Jun-10
Negative on 24-Jun-10
Positive on 6-Aug-10
Negative on 13-Aug-10
Positive on 3-Sep-10
Negative on 18-Mar-11
Positive on 25-Mar-11
Negative on 17-Jun-11
Positive on 30-Jun-11
Neutral on 29-Jul-11
Negative on 5-August-11
Positive on 28-October-11
Negative on 23-November-11
Positive on 3-December-11
Negative on 16-December-11
Positive on 30-December-11


