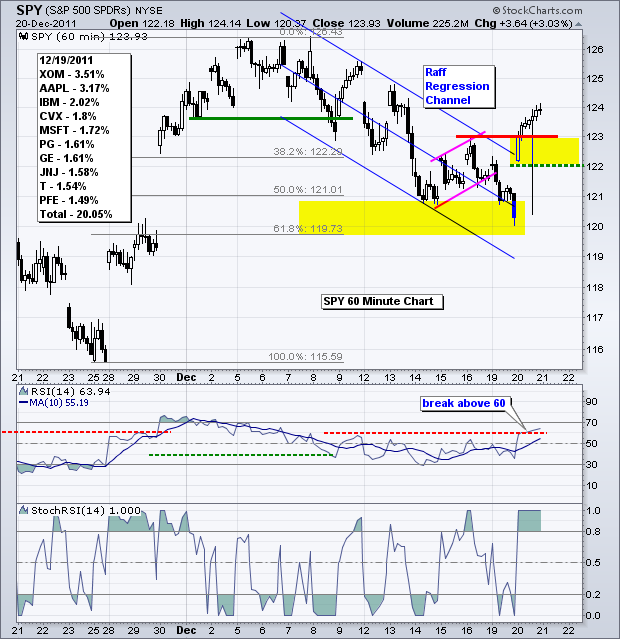
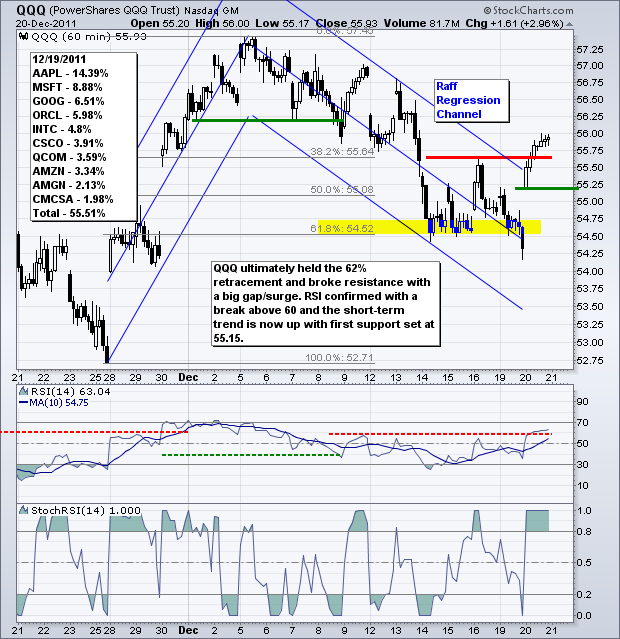
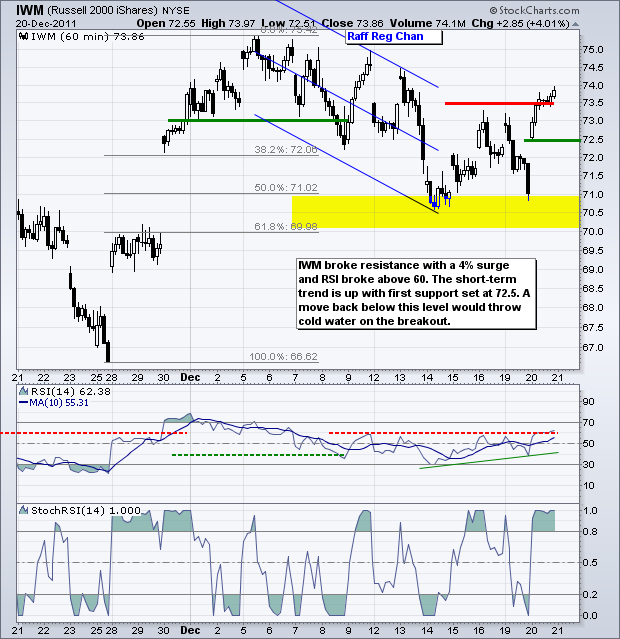
The European Central Bank (ECB) is opening the monetary floodgates today. While they may not call it quantitative easing (QE) by name, the ECB is essentially giving money to European banks so they can stimulate the economy with increased lending. Seems I've heard this one before. The US version on this program prompted banks to shore up their balance sheets. Perhaps lending eventually expanded, but the balance sheet will likely be the bank's first priority. In any case, Santa Claus arrived on Wall Street to spark a big broad rally. All sectors were up 2% or more. On the 60-minute chart, the S&P 500 ETF (SPY) broke above channel resistance with a 3% surge on Tuesday. This breakout puts SPY at an interesting juncture. First, the ETF surged from 116 to 126. Second, the correction formed a falling price channel on the 60-minute chart and a falling flag on the daily chart. Third, the ETF found support in the 50-61.80% retracement zone and RSI formed a small bullish divergence over the last few days. Fourth, the gap and breakout signal a continuation of the prior advance. Based on traditional technical analysis, the upside target is around 130. The length of the prior advance (126 – 116 = 10) is added to the channel low (120 + 10 = 130). A strong breakout should hold. Therefore, I am marking initial support in the 122-123 area. A move back below 122 would negate the breakout and argue for a reassessment.
**************************************************************************
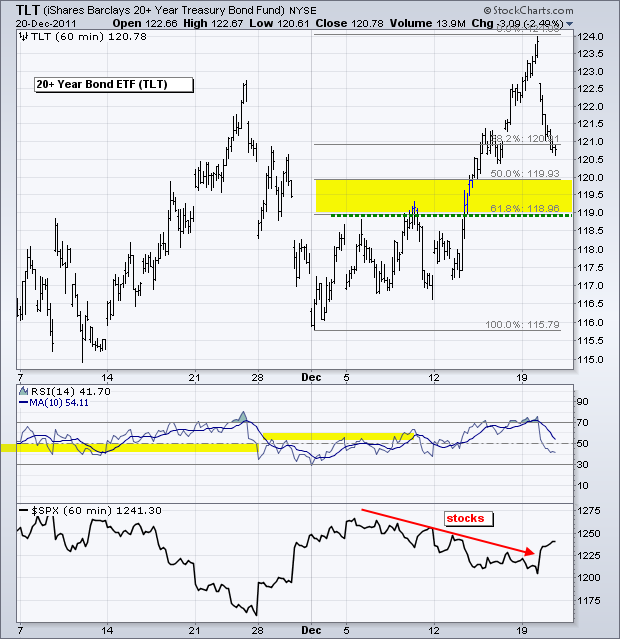
US Treasuries came crashing down as the appetite for risk surged on Tuesday. The 20+ year Bond ETF (TLT) was very overbought after a 6+ percent surge the first half of December. Yesterday's 2.5% decline was also a bit extreme, but could continue if money remains in risk-on mode. Broken resistance and the 50-61.80% retracements mark the first support zone around 119-120.
**************************************************************************
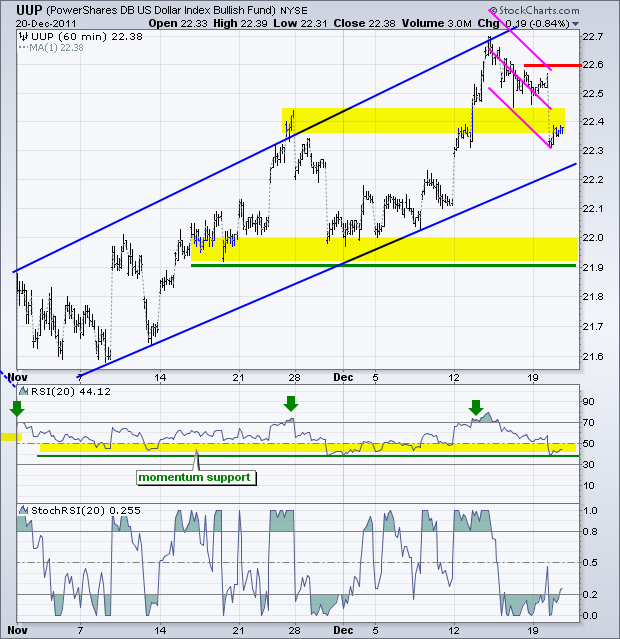
The Euro surged as the European Central Bank (ECB) prepared to embark on its version of quantitative easing (QE). This is short-term positive for the Euro because it provides badly needed liquidity to the financial system. It is long-term negative because the European Central Bank is basically printing money and diluting the currency. Nevertheless, the Euro rally could extend a few more days. The US Dollar Fund (UUP) broke the first support zone and RSI moved into the 40-50 zone. The channel trendline marks next support in the 22.25 area.
**************************************************************************
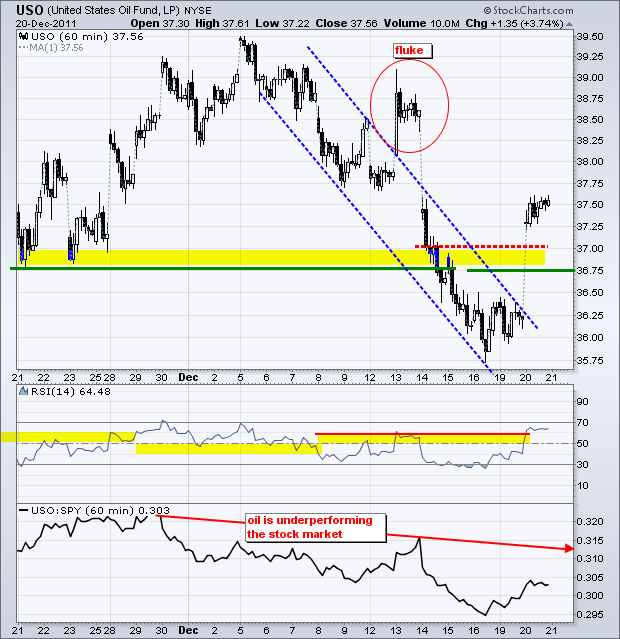
Flag breakouts in the major index ETFs can only be bullish for oil. Crude was also helped by weakness in the Dollar. The US Oil Fund (USO) surged above broken support with a big move on Tuesday and RSI broke above 60. This is enough to reverse the short-term downtrend and I will set short-term support back at prior support (36.75).
**************************************************************************
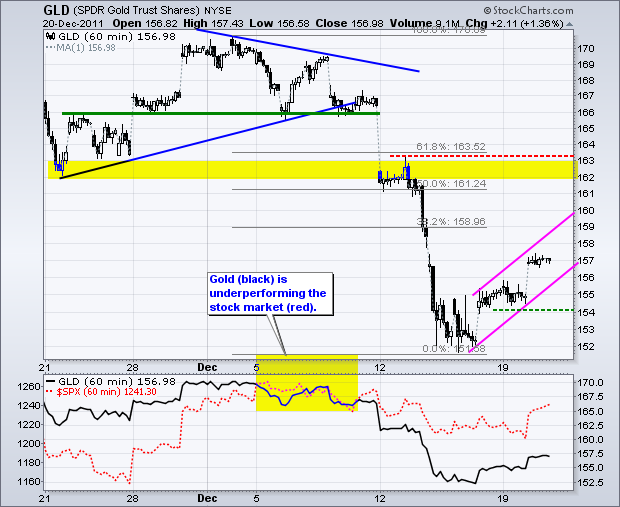
Weakness in the Dollar and strength in the stock market propelled gold higher as the Gold SPDR (GLD) surged to 157. The whole move occurred on the open and the ETF consolidated around this level the entire day. While it still looks like an oversold bounce within a bigger downtrend, continued strength in stocks could extend the bounce. Resistance is set in the 162-163 area from broken support and the 50-61.80% retracements. Support set at 154.
**************************************************************************
Key Economic Reports:
Wed - Dec 21 - 07:00 - MBA Mortgage Index
Wed - Dec 21 - 10:00 - Existing Home Sales
Wed - Dec 21 - 10:30 - Crude Inventories
Thu - Dec 22 - 08:30 - Initial Claims
Thu - Dec 22 - 08:30 - GDP
Thu - Dec 22 - 09:55 - Michigan Sentiment
Thu - Dec 22 - 10:00 - Leading Indicators
Fri - Dec 23 - 08:30 - Durable Orders
Fri - Dec 23 - 08:30 - Personal Income/Personal Spending
Fri - Dec 23 - 10:00 - New Home Sales
Charts of Interest: Tuesday and Thursday in separate post.
This commentary and charts-of-interest are designed to stimulate thinking. This analysis is not a recommendation to buy, sell, hold or sell short any security (stock ETF or otherwise). We all need to think for ourselves when it comes to trading our own accounts. First, it is the only way to really learn. Second, we are the only ones responsible for our decisions. Think of these charts as food for further analysis. Before making a trade, it is important to have a plan. Plan the trade and trade the plan. Among other things, this includes setting a trigger level, a target area and a stop-loss level. It is also important to plan for three possible price movements: advance, decline or sideways. Have a plan for all three scenarios BEFORE making the trade. Consider possible holding times. And finally, look at overall market conditions and sector/industry performance.

