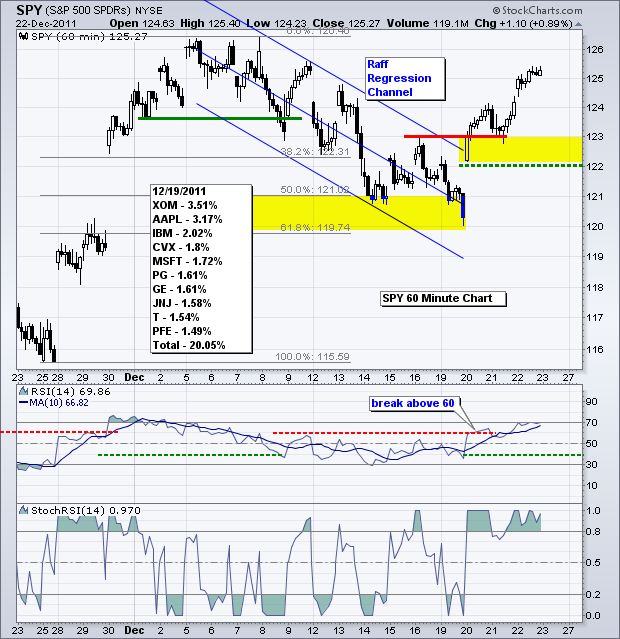
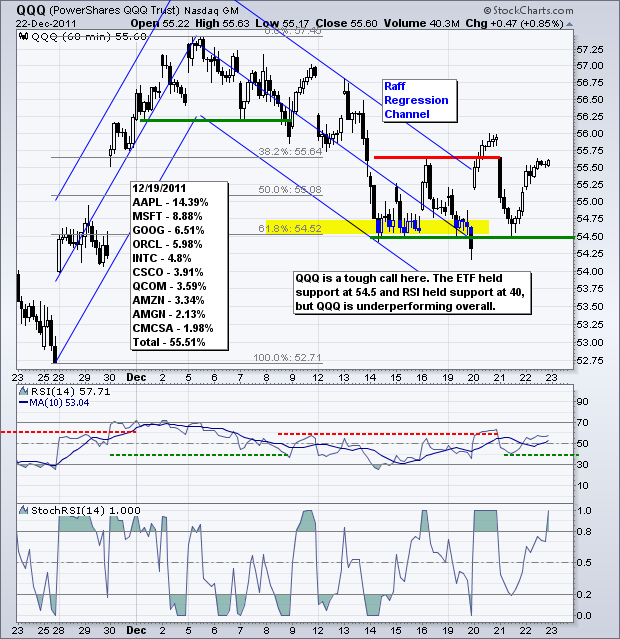
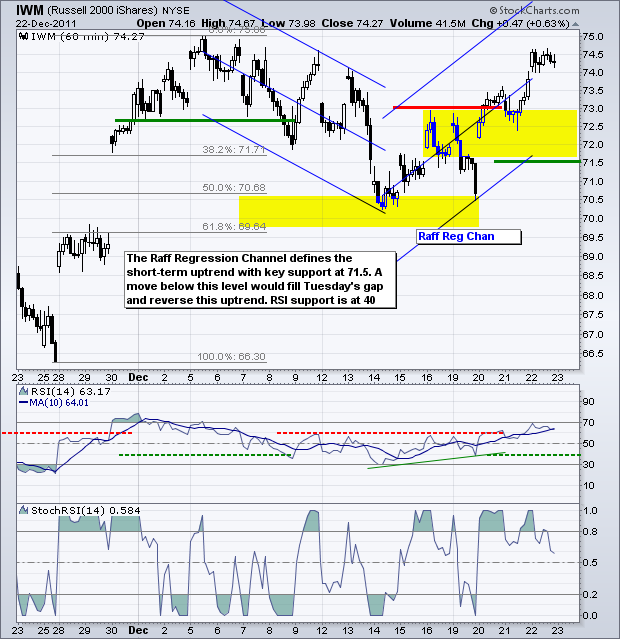
First, note that Art's Charts will not be published next Monday through Thursday. It is a fine time for family and Christmas. Commentary will resume on Friday, December 30th. Merry Christmas and Happy Holidays from all of us at Stockcharts.com. Now to the charts! The good ole Santa Claus rally continues as the S&P 500 ETF (SPY) tacked on another .89% on Thursday. Overall, the ETF reversed its prior downtrend near the 61.80% and broke channel resistance with a gap/surge on Tuesday. This breakout held as the ETF extended its rally above 125. Broken resistance turns first support in the 122-123 zone. This level is reinforced after the extension. A decline below 122 would negate the breakout and put the bears back in control. RSI broke above 60 to confirm the trend reversal on Tuesday. Momentum support is set at 40.
**************************************************************************
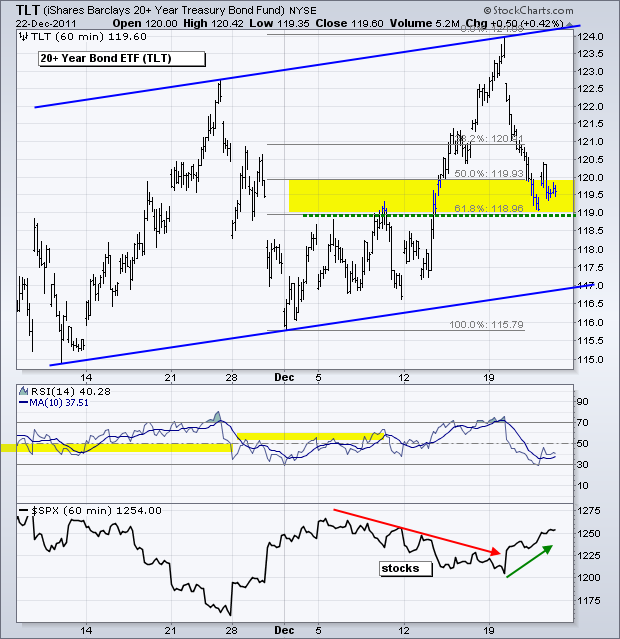
The 20+ Year T-Bond ETF (TLT) found a little support in the 119-119.5 area. The 61.80% retracement line and broken resistance mark support here. A lot depends on stocks and the Euro. Continued strength in stocks and the Euro would deepen the decline. There is also a large rising channel on the chart with parallel trendlines. The lower trendline extends to the next big support zone around 117.90.
**************************************************************************
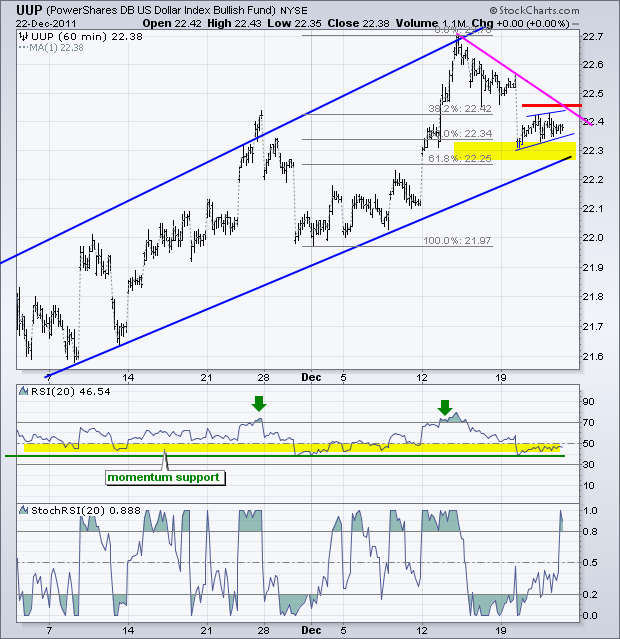
The US Dollar Fund (UUP) firmed in the 22.3-22.4 area. Support here stems from the 50-61.80% zone and the November trendline will soon come into play. Also note that RSI is in its support zone (40-50). The long-term trend is up for the greenback, but prices became overextended with the surge from 22 to 22.7. I expect the uptrend to resume at some point. A move above 22.46 would break first resistance and trigger the first bullish signal. Since falling below 22.4, the ETF consolidated the last two days. It is also possible that a small rising flag/wedge is forming. A break below 22.3 would signal a continuation lower.
**************************************************************************
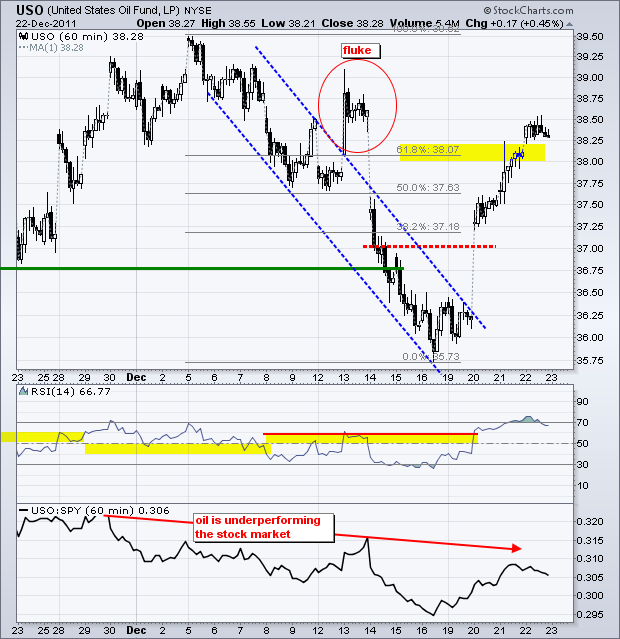
The US Oil Fund (USO) extended its gains on Thursday and is now above the 61.80% retracement. Nevertheless, the ETF is short-term overbought after a 7.5% advance from low to high the last five days. As noted before, a lot will depend on the stock market and the Euro. Oil is part of the risk-on trade. Further strength in stocks and the Euro would be bullish for oil. Therefore, my bias is with the oil bulls as long as SPY holds its breakout and the US Dollar Fund (UUP) remains below first resistance.
**************************************************************************
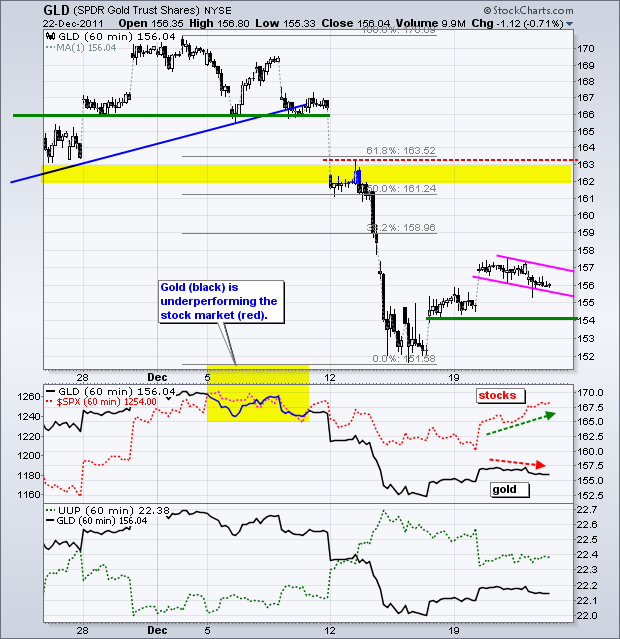
The Gold SPDR (GLD) has been moving opposite the Dollar lately. The lower indicator window shows gold (black) and the Dollar (green). The Dollar moved higher from 12 December and gold fell sharply. The Dollar has since been correcting and gold has been edging higher. The bounce in gold is quite cautious, which could reflect market suspicions that the Euro is ultimately heading lower (Dollar higher). Watch the first resistance level on the UUP chart. On the price chart, GLD corrected the last three days with a falling consolidation. A break above 157.1 would signal a continuation higher and target further strength towards the 161-163 area. Key support remains at 154.
**************************************************************************
Key Economic Reports:
Fri - Dec 23 - 08:30 - Durable Orders
Fri - Dec 23 - 08:30 - Personal Income/Personal Spending
Fri - Dec 23 - 10:00 - New Home Sales
Charts of Interest: Tuesday and Thursday in separate post.
This commentary and charts-of-interest are designed to stimulate thinking. This analysis is not a recommendation to buy, sell, hold or sell short any security (stock ETF or otherwise). We all need to think for ourselves when it comes to trading our own accounts. First, it is the only way to really learn. Second, we are the only ones responsible for our decisions. Think of these charts as food for further analysis. Before making a trade, it is important to have a plan. Plan the trade and trade the plan. Among other things, this includes setting a trigger level, a target area and a stop-loss level. It is also important to plan for three possible price movements: advance, decline or sideways. Have a plan for all three scenarios BEFORE making the trade. Consider possible holding times. And finally, look at overall market conditions and sector/industry performance.

