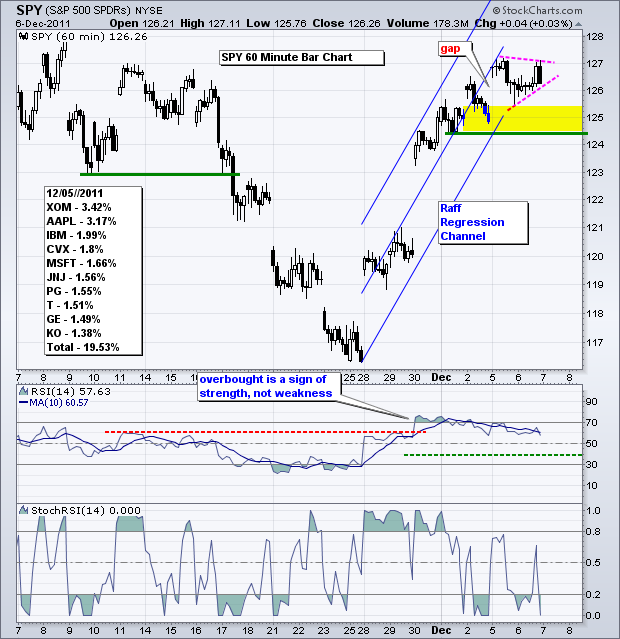
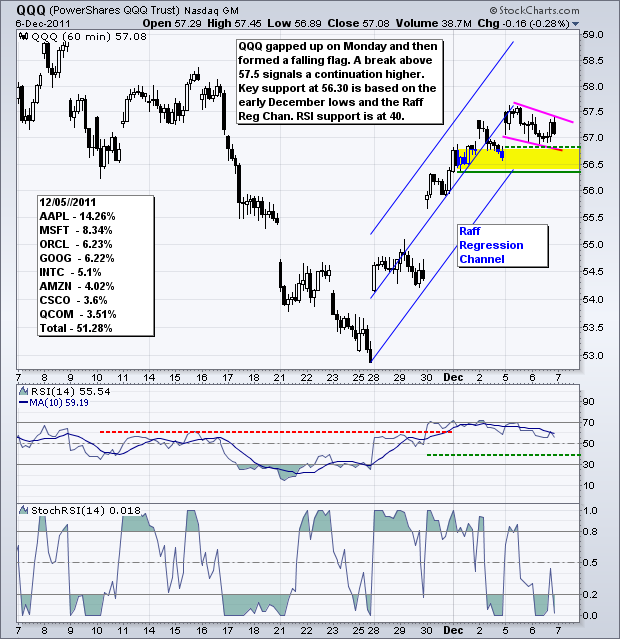
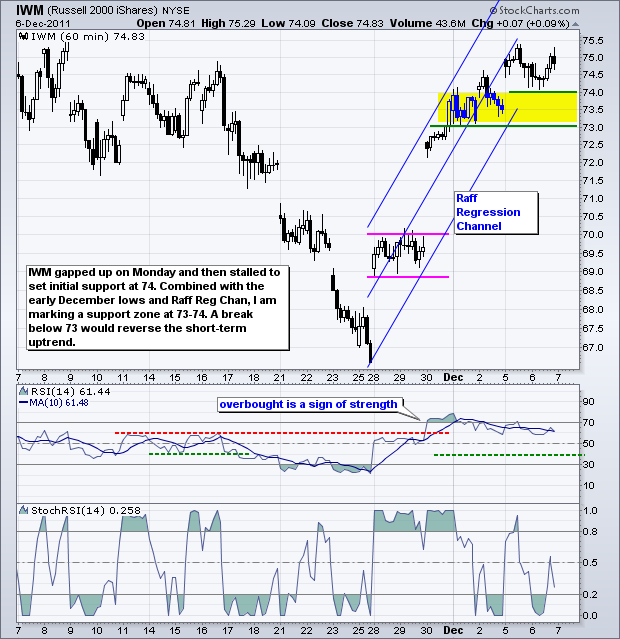
The stock market held its breadth yesterday as the major index ETFs were barely changed the entire day. No change in the short-term uptrend means the short-term uptrend remains in play. According to the financial press, stocks are waiting for clues from Europe, which will start to flow on Thursday. The European Central Bank (ECB) meets and is expected to issue a dovish policy statement. The prospect of lower rates would be Euro bearish. Most analysts expect lower rates from the ECB. Quantitative easing (QE) is the real wild card. How accommodating will the ECB be towards the European debt dilemma? I expect a three prong approach to the European debt issue. These will include new fiscal controls from a new European treaty, some sort of QE from the ECB and some sort of IMF involvement. It is beyond complicated and I am not sure if we will really have much more clarity next week. This weekend's summit could be a mess and the communiqué is likely to contain the words hope, promise and commitment. The best we can do is watch the charts for real clues. On the SPY chart, the ETF gapped up on Monday and consolidated with a pennant. The gap held and the ETF has a support zone around 125. The early December lows and Raff Regression Channel mark support there. A break below the early December lows would reverse this short-term uptrend. A break above yesterday afternoon's high would signal a continuation higher.
**************************************************************************
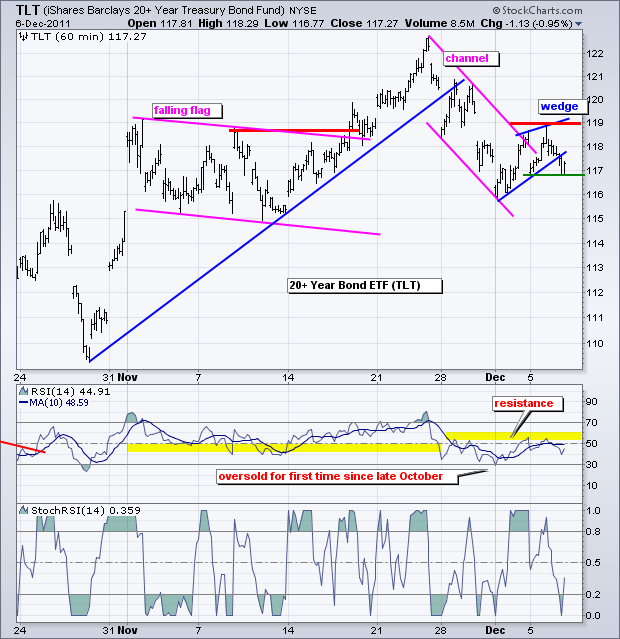
The 20+ year Bond ETF (TLT) declined from resistance and broke wedge support around 117.50. This decline reinforces resistance at 119. Also notice that RSI failed at the 50-60 resistance zone. Weakness in Treasuries reflects an appetite for risk, which is positive for stocks. Proceeds from Treasury bond sales have to go somewhere. At this point, the short-term downtrend in TLT is conducive to the short-term uptrend in SPY. A break above 119 would reverse this short-term downtrend and be bearish for stocks.
**************************************************************************
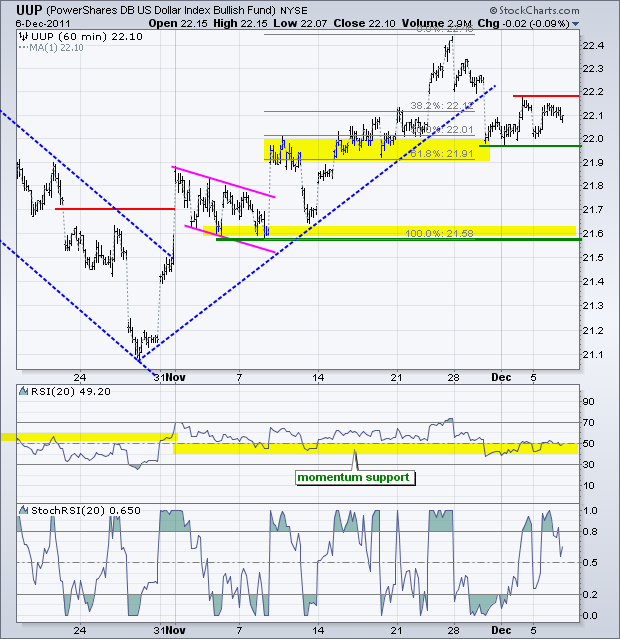
The US Dollar Fund (UUP) continues to consolidate within a tight range. I am watching these boundaries for the next directional signal. RSI is also stuck in a range as it consolidates in the 40-50 zone. This zone acts as support in an uptrend. A break below 40 in RSI and 21.95 in UUP would be bearish. It could be a wild few days for the Euro and the Dollar. Lower interest rates and QE from the ECB might be seen as Euro bullish at first, but they are ultimately Euro bearish. Forex traders will also be watching the progress at the EU summit. Success would be Euro bullish, while failure would be Euro bearish.
**************************************************************************
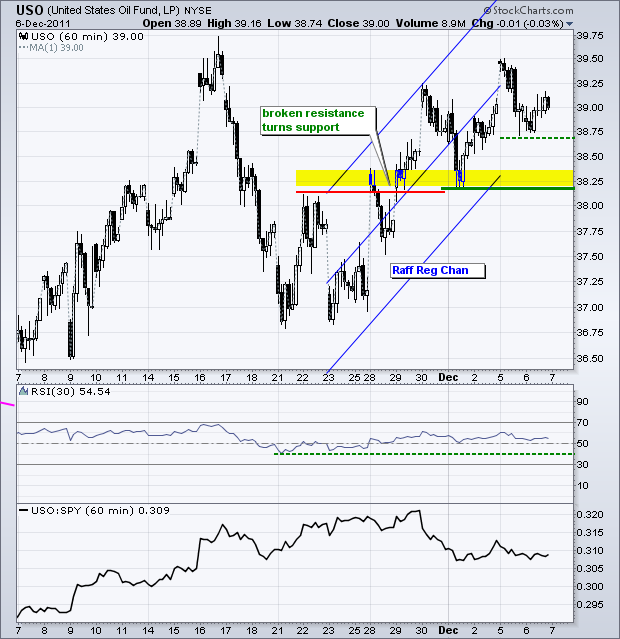
No change. The US Oil Fund (USO) continues to work its way higher with a rising zigzag since November 23rd. Broken resistance turned into support in the 38.25 area. The end of the Raff Regression Channel confirms support here. A move below the early December low would break this support zone and reverse the short-term uptrend. Oil and stocks have been positively correlated this year so keep an eye on stocks for clues on energy demand.
**************************************************************************
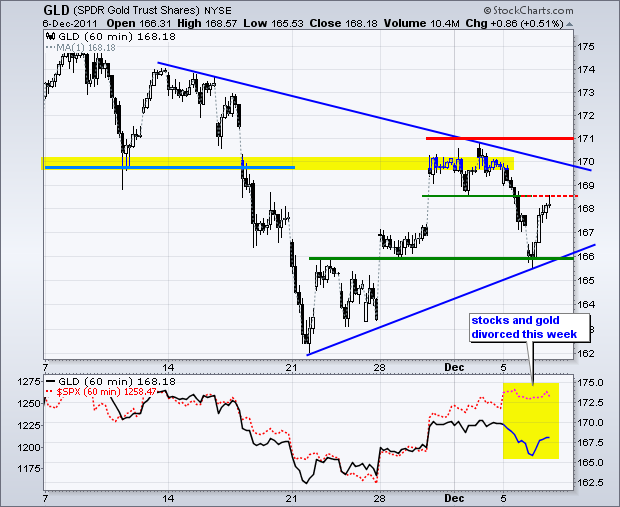
The noose is tightening as surges and the pullbacks in the Gold SPDR (GLD) grow shorter. This makes for a Symmetrical Triangle over the last few weeks. GLD broke minor support on Monday and declined to key support at 166. The ETF got a nice bounce on Tuesday afternoon to affirm this support level. Broken support at 168.50 now turns into minor resistance. The long-term trend for gold is still up so I will still give the bulls the benefit of the doubt as long as support at 166 holds.
**************************************************************************
Key Economic Reports:
Wed - Dec 07 - 07:00 - MBA Mortgage Index
Wed - Dec 07 - 10:30 - Crude Inventories
Wed - Dec 07 - 15:00 - Consumer Credit
Thu - Dec 08 - 08:30 - Initial Claims
Thu - Dec 08 - 08:30 – ECB Policy Statement
Thu - Dec 08 - 10:00 - Wholesale Inventories
Fri - Dec 09 - 09:55 - Michigan Sentiment
Charts of Interest: Tuesday and Thursday in separate post.
This commentary and charts-of-interest are designed to stimulate thinking. This analysis is not a recommendation to buy, sell, hold or sell short any security (stock ETF or otherwise). We all need to think for ourselves when it comes to trading our own accounts. First, it is the only way to really learn. Second, we are the only ones responsible for our decisions. Think of these charts as food for further analysis. Before making a trade, it is important to have a plan. Plan the trade and trade the plan. Among other things, this includes setting a trigger level, a target area and a stop-loss level. It is also important to plan for three possible price movements: advance, decline or sideways. Have a plan for all three scenarios BEFORE making the trade. Consider possible holding times. And finally, look at overall market conditions and sector/industry performance.


