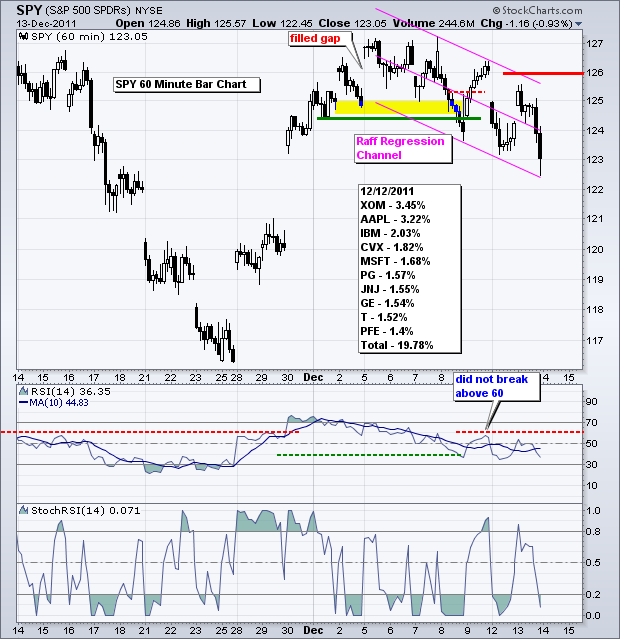
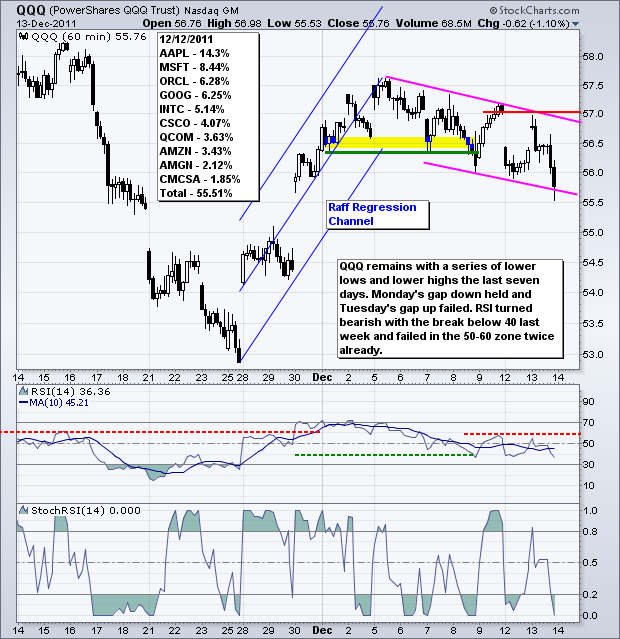
The risk-off trade took hold in the markets with stocks and the Euro falling. Bonds and the Dollar surged, but oil bucked the trend with a big gain. I am not sure how long oil can hold up in the face of a strong Dollar and weak stock market. In any case, the weak Euro continues to weigh on the US stock market and benefit US Treasuries, which are the safe-haven play. The S&P 500 ETF (SPY) gapped up on the open, but did not hold these gains and moved to a new low for the current downtrend, which began with last Thursday's support break. A clear series of lower lows and lower highs has taken shape since early last week. The Raff Regression Channel and yesterday's high mark a resistance zone in the 125.50 area. I will set key resistance at 126 for now. RSI remains in bear mode after a break below 40 last week and the failure at 60 on Friday. A break above 60 is needed to turn momentum bullish again.
**************************************************************************
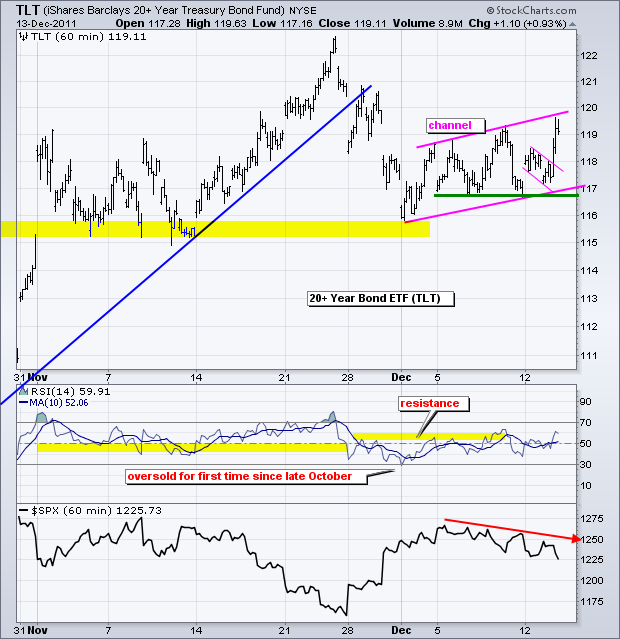
The 20+ year Bond ETF (TLT) surged above 119 to forge a higher high and keep the rising channel alive. The falling channel in SPY offsets this rising channel in Treasuries. The trend is clearly up as long as the channel holds. Key support is set at 116.90.
**************************************************************************
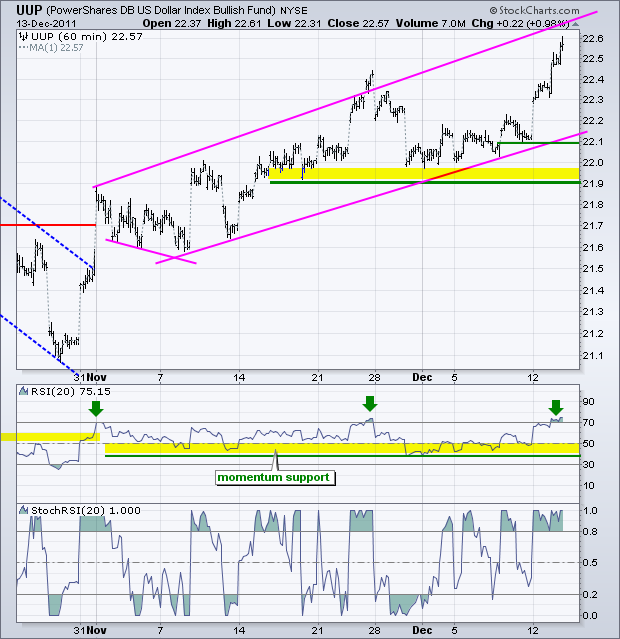
The US Dollar Fund (UUP) extended its surge as money moved out of the Euro in a hurry. A bigger rising channel could be taking shape with the upper trendline extending to the 22.8 area in the next few days. RSI became overbought for the third time since early November. Even though overbought may foreshadow a pullback, don't forget that overbought readings are a sign of overall strength, not weakness.
**************************************************************************
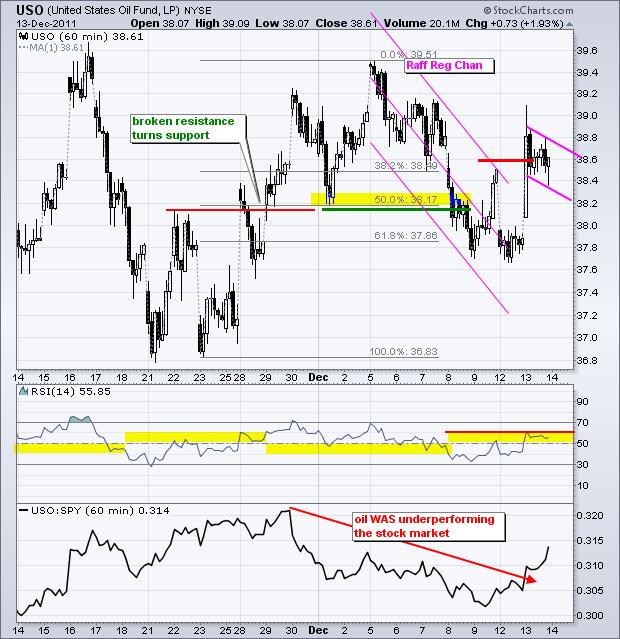
The US Oil Fund (USO) surged above 38.8 on reports that Iran was flexing its muscles in the Strait of Hormuz. OPEC meets today and this outcome could further affect oil prices. USO formed a falling flag after the surge and a break back above 38.8 would signal a continuation higher. A move back below 38.3 would suggest a failed breakout. This would be especially bearish if stocks and the Euro continue to fall.
**************************************************************************
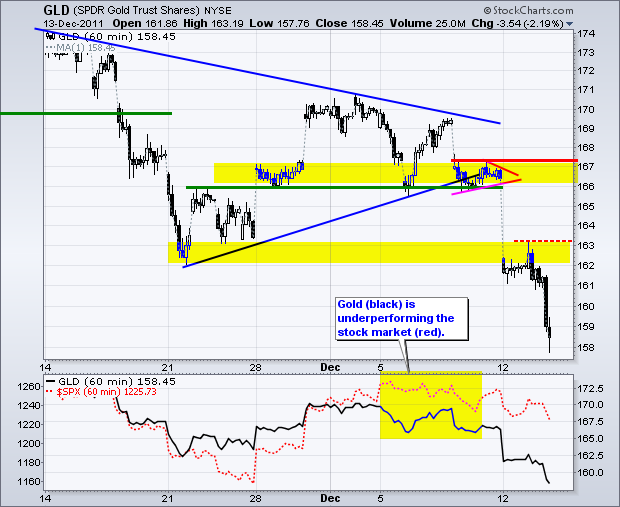
Gold continued sharply lower as the Gold SPDR (GLD) plunged below 159. The October lows around 155 mark the next support zone. Gold itself has next support in the 1600 area. 14-day RSI on the daily chart is oversold, but there are simply no signs of firmness yet. Moreover, gold is under pressure from a weak stock market and strong Dollar. On the GLD chart, broken support around 162-163 turns into the first resistance zone.
**************************************************************************
Key Economic Reports:
Wed - Dec 14 - 07:00 - MBA Mortgage Index
Wed - Dec 14 - 10:30 - Oil Inventories
Thu - Dec 15 - 08:30 - Jobless Claims
Thu - Dec 15 - 08:30 - PPI
Thu - Dec 15 - 08:30 - Empire State Manufacturing
Thu - Dec 15 - 09:15 - Industrial Production
Thu - Dec 15 - 10:00 - Philadelphia Fed Report
Fri - Dec 16 - 08:30 – Consumer Price Index (CPI)
Charts of Interest: Tuesday and Thursday in separate post.
This commentary and charts-of-interest are designed to stimulate thinking. This analysis is not a recommendation to buy, sell, hold or sell short any security (stock ETF or otherwise). We all need to think for ourselves when it comes to trading our own accounts. First, it is the only way to really learn. Second, we are the only ones responsible for our decisions. Think of these charts as food for further analysis. Before making a trade, it is important to have a plan. Plan the trade and trade the plan. Among other things, this includes setting a trigger level, a target area and a stop-loss level. It is also important to plan for three possible price movements: advance, decline or sideways. Have a plan for all three scenarios BEFORE making the trade. Consider possible holding times. And finally, look at overall market conditions and sector/industry performance.

