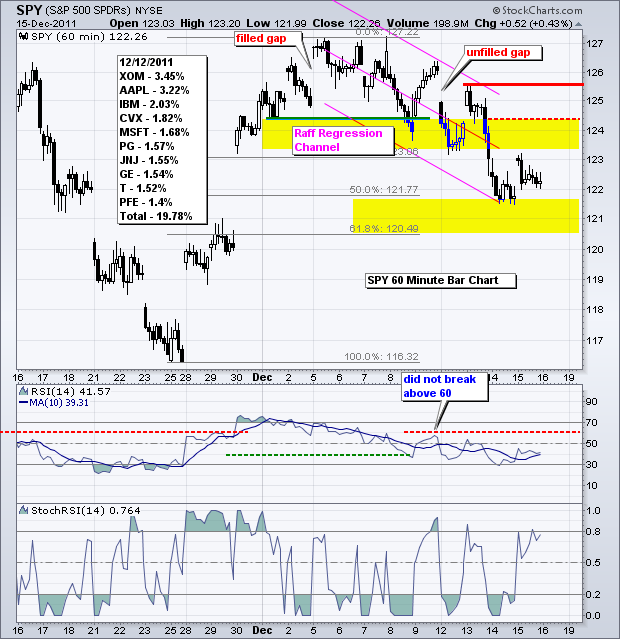
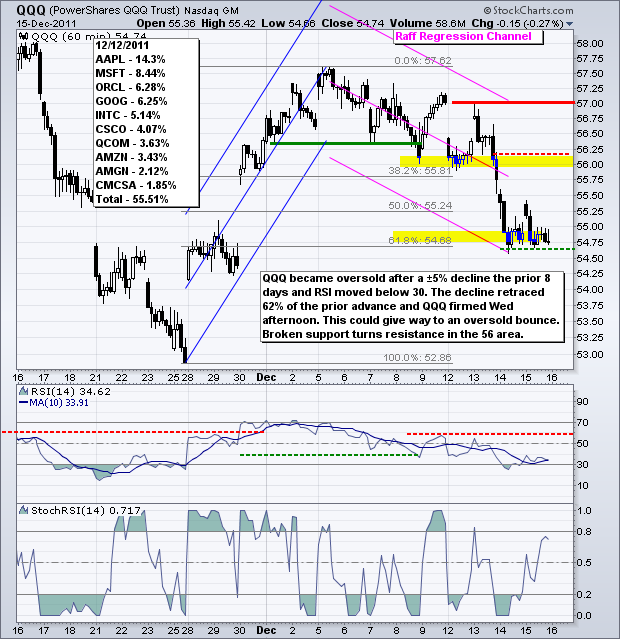
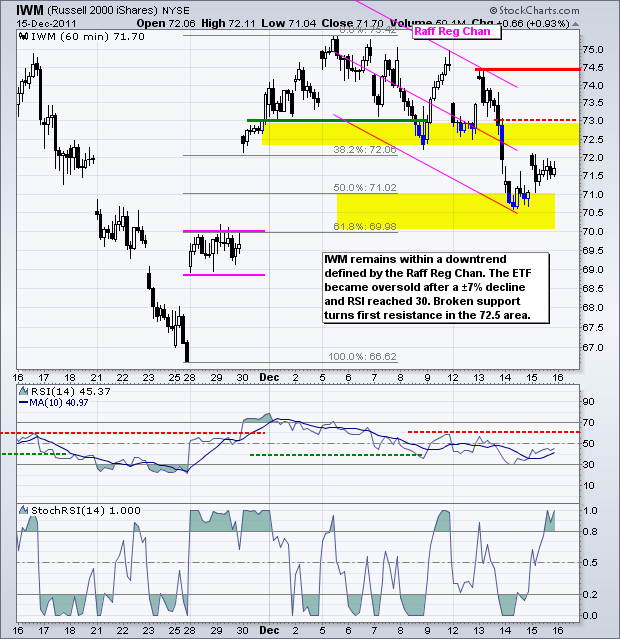
Stocks got a bounce as the Euro finally firmed for a day. The seasonal patterns for the stock market are still bullish this time of year. These include yearend window dressing, the Santa Claus rally, historic returns in December, the January effect and the six-month cycle. It is also interesting to note that the CBOE Volatility Index ($VIX) has moved lower the last five days. One would normally expect the VIX to move higher when stocks move sharply lower. Despite bullish seasonals and a strange VIX, buyers are scare because many institutions have already closed their books on 2011. This means we could see some thin trading and possibly even some exaggerated moves. It is the seasonal patterns versus the current downtrend and risk-off environment. As it now stands, risk-off is clearly winning the short-term battle. On the 60-minute chart, the S&P 500 ETF (SPY) remains in a downtrend defined by the Raff Regression Channel. This decline retraced 50% of the prior advance and the ETF managed to bounce on Thursday. Even though there was no follow through to Thursday's strong open, SPY managed to hold on for a modest gain on the day. As far as resistance, broken support turns into the first resistance zone in the 124 area. RSI broke down last week and established resistance in the 50-60 zone.
**************************************************************************
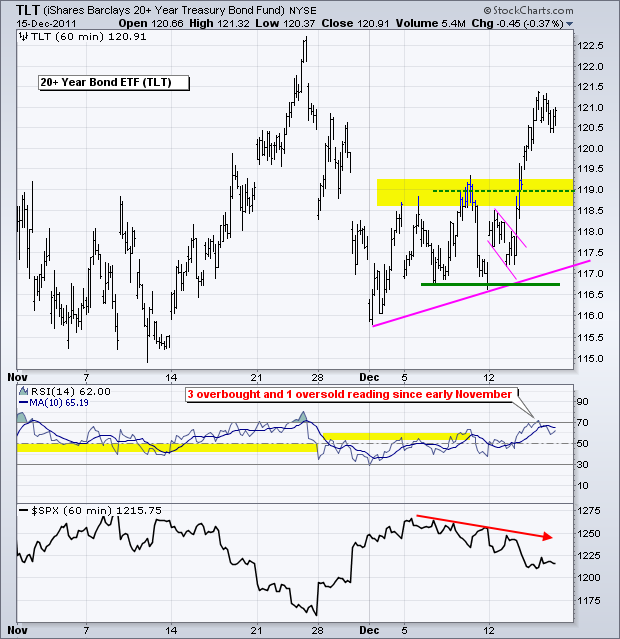
The 20+ year Bond ETF (TLT) pulled back as stocks and the Euro firmed. The ETF was a bit overbought after a surge from 117 to 121 in just a few days. The overall trend is clearly up here with broken resistance turning into support in the 119 area.
**************************************************************************
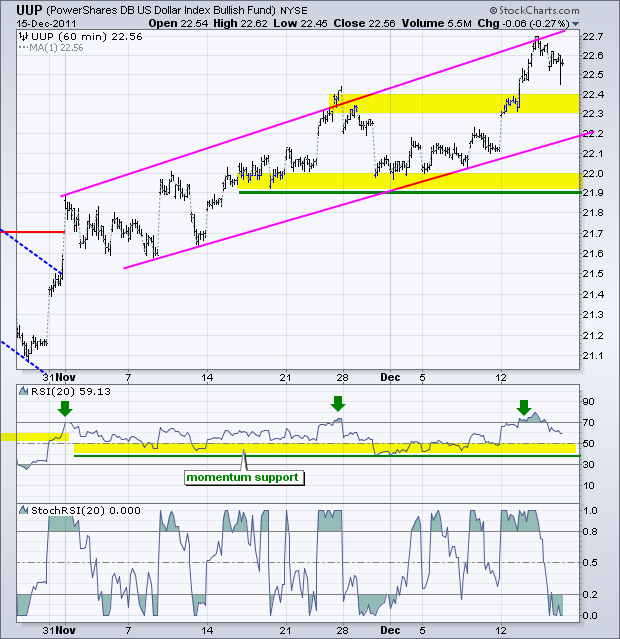
The US Dollar Fund (UUP) surged to the upper trendline of the rising channel and pulled back on Thursday. This uptrend is not in question. The only debate is on a potential pullback. Broken resistance turns into first support in the 22.30-22.40 area. The 40-50 zone turns first support for RSI.
**************************************************************************
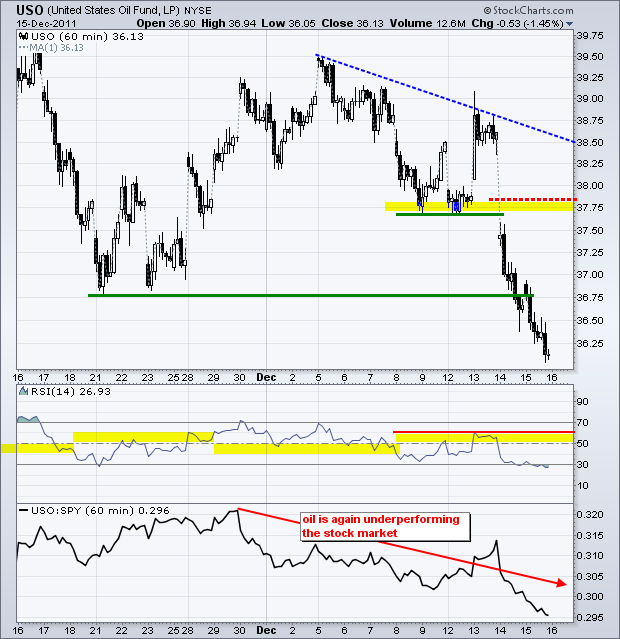
The US Oil Fund (USO) broke down on Wednesday and continued weak on Thursday. The ETF is already short-term oversold, but in a bit of a freefall. Broken support turns first resistance in the 37.75 area. It is also possible that broken support in the 36.75-37 area turns into resistance. RSI resistance is set in the 50-60 zone. I am not sure what winter is like where you are right now, but our winter is currently much milder than last year or the year before. This anecdotal evidence suggests that demand for heating oil may be down.
**************************************************************************
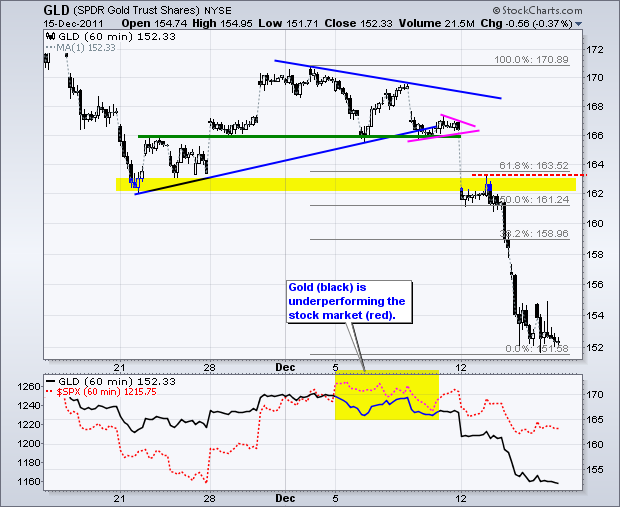
The Gold SPDR (GLD) attempted to bounce, but fell back and closed with a small loss. This is still bottom pickers territory. Only those ready to exit on a break below 151.6 need apply. GLD is certainly oversold and could get an oversold bounce, provided the stock market and Dollar help out. Help from these two is far from certain though. Broken support and the 50-61.80% retracements mark first resistance around 162-164.
**************************************************************************
Key Economic Reports:
Fri - Dec 16 - 08:30 – Consumer Price Index (CPI)
Charts of Interest: Tuesday and Thursday in separate post.
This commentary and charts-of-interest are designed to stimulate thinking. This analysis is not a recommendation to buy, sell, hold or sell short any security (stock ETF or otherwise). We all need to think for ourselves when it comes to trading our own accounts. First, it is the only way to really learn. Second, we are the only ones responsible for our decisions. Think of these charts as food for further analysis. Before making a trade, it is important to have a plan. Plan the trade and trade the plan. Among other things, this includes setting a trigger level, a target area and a stop-loss level. It is also important to plan for three possible price movements: advance, decline or sideways. Have a plan for all three scenarios BEFORE making the trade. Consider possible holding times. And finally, look at overall market conditions and sector/industry performance.

