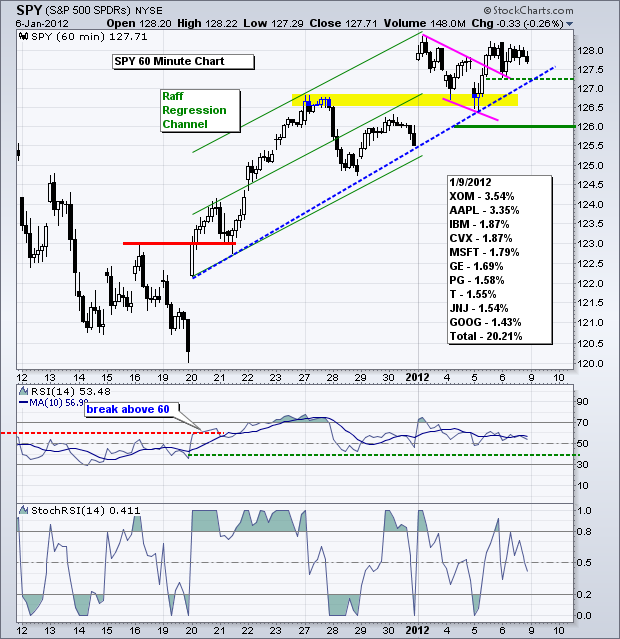
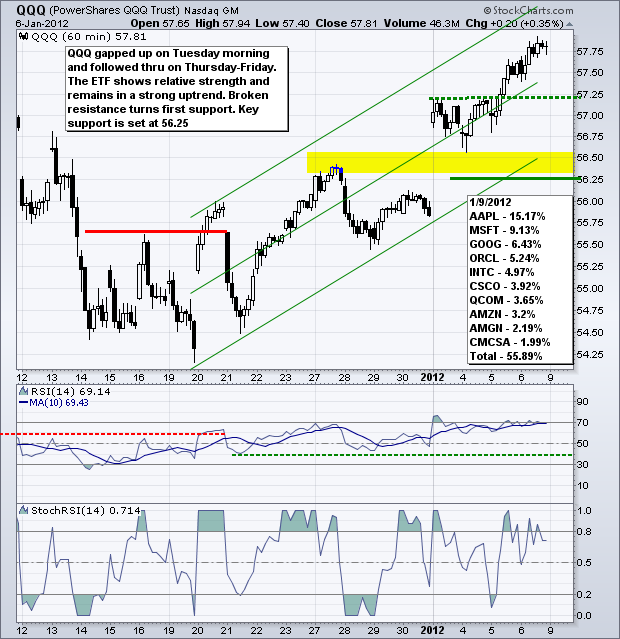
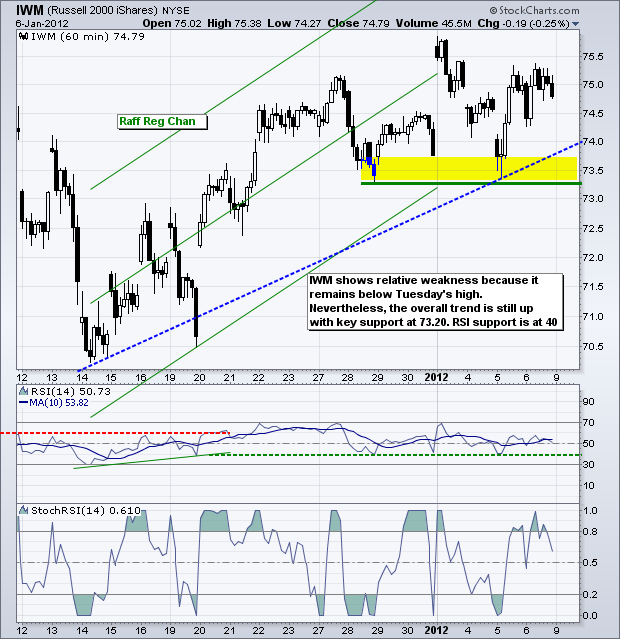
The S&P 500 ETF (SPY) did not move much after Tuesday's opening gap, but did manage to hold its gains and close near the high for the week. Even though the ETF did not follow through on this gap, the gains are still holding and the cup remains half full (bullish). A trend in motion stays in motion so I will expect higher prices as long as the uptrend holds. The ETF started this uptrend with a gap and breakout on 20-December. SPY since formed a series of rising peaks and rising troughs. After Tuesday's gap, the ETF corrected with a falling flag. SPY broke flag resistance with a surge to 128 and this breakout is holding. A move below 127.2 would negate the flag breakout and break the trendline extending up from 20-Dec. While such a move would be negative, I am leaving key support at 126 for now and RSI support at 40. Keep in mind that the medium-term trend is up with a higher low in late November and higher high in early January. I prefer to respect the bigger uptrend with wider support levels.
**************************************************************************
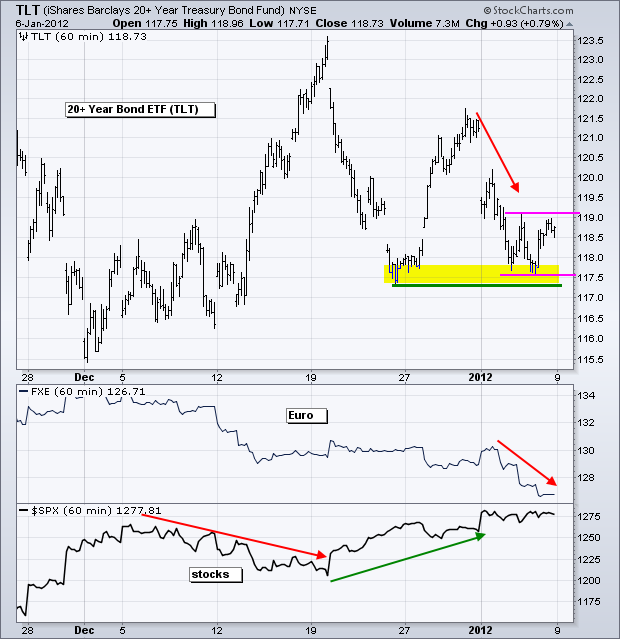
The dynamic between the Euro and the Treasuries changed in the latter part of December. Prior to this change, the Euro and Treasuries were negatively correlated. Treasuries rallied when the Euro declined and visa versa. The Euro declined throughout December and into the first week of January. This would normally be bullish for Treasuries, but the 20+ Year T-Bond ETF (TLT) did not rally and fell rather sharply the last three weeks. Strong reports on the US economy are likely weighing on Treasuries. TLT is currently testing support from the late December low with a consolidation. A break below 117.5 would signal a continuation lower, while a break above 119.1 would reinforce support and keep the bigger uptrend alive.
**************************************************************************
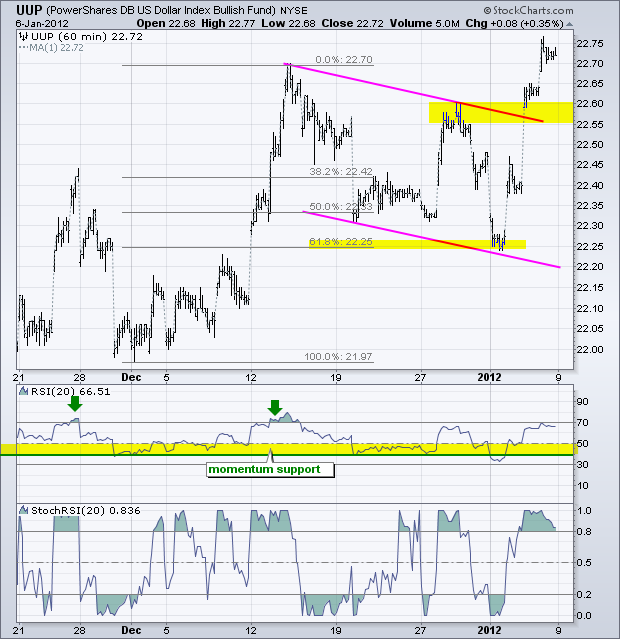
The US Dollar Fund (UUP) moved from oversold conditions on Tuesday to overbought conditions on Friday. Even so, the overall trend remains up as UUP broke flag resistance with a big surge. Broken resistance in the 22.55-22.60 area turns into the first support zone to watch on a throwback. Merkel and Sarkozy are meeting today to continue discussions on the same old issues. Spain and Italy will test the bond market with auctions on Thursday. The resulting yields on these new bonds will affect the Euro.
**************************************************************************
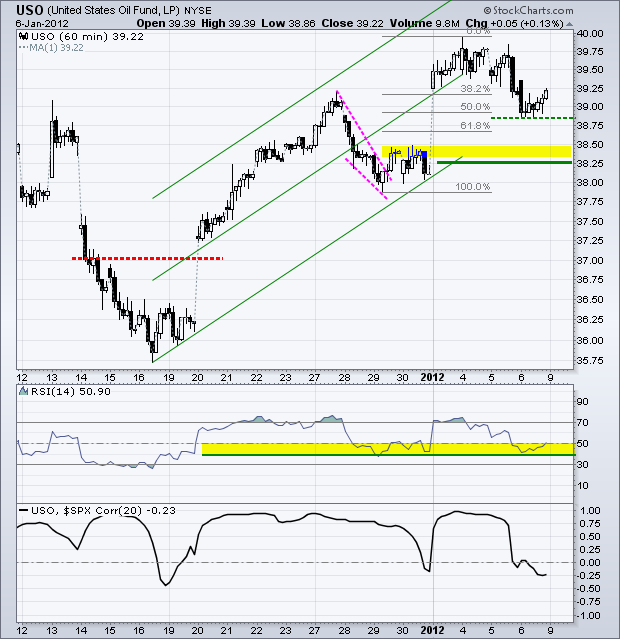
The US Oil Fund (USO) firmed and bounced on Friday, but the bounce was rather feeble. Nonetheless, the overall trend is up as oil continues to move in concert with the stock market (up). Friday's lows mark the first support zone. Also notice that the pullback retraced 50-61.80% of the prior surge and RSI is testing support in the 40-50 zone. Key support remains in the 38.25-38.50 area.
**************************************************************************
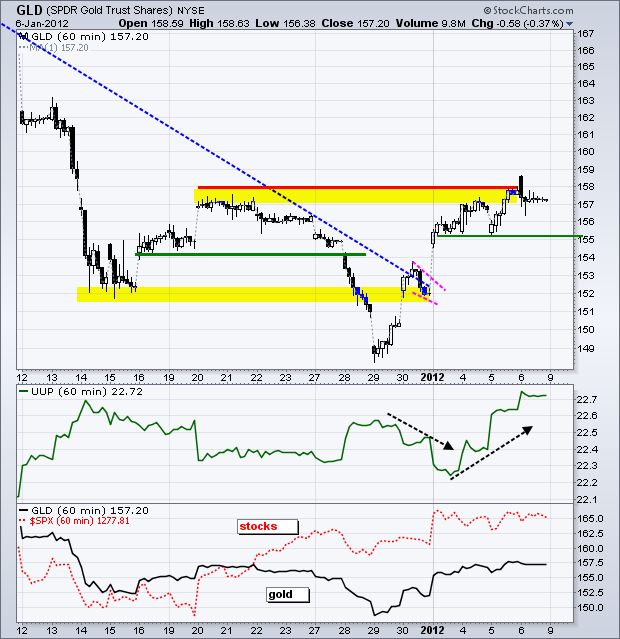
The Dollar surged and gold held its gains. Impressive. The Gold SPDR (GLD) surged to resistance and consolidated in the 155-158 area most of last week. Support at 155 holds the first key. An ultimate failure at resistance and break below this level would argue for further weakness towards the December lows.
**************************************************************************
Key Economic Reports:
Mon - Jan 09 - 15:00 - Consumer Credit
Tue - Jan 10 - 10:00 - Wholesale Inventories
Wed - Jan 11 - 07:00 - MBA Mortgage Purchase Index
Wed - Jan 11 - 10:30 - Oil Inventories
Wed - Jan 11 - 14:00 - Fed Beige Book
Thu - Jan 12 - 08:30 - Jobless Claims
Thu - Jan 12 - 08:30 – Spain and Italy Bond Auction
Thu - Jan 12 - 08:30 - Retail Sales
Thu - Jan 12 - 10:00 - Business Inventories
Fri - Jan 13 - 09:55 - Michigan Sentiment
Charts of Interest: Tuesday and Thursday in separate post.
This commentary and charts-of-interest are designed to stimulate thinking. This analysis is not a recommendation to buy, sell, hold or sell short any security (stock ETF or otherwise). We all need to think for ourselves when it comes to trading our own accounts. First, it is the only way to really learn. Second, we are the only ones responsible for our decisions. Think of these charts as food for further analysis. Before making a trade, it is important to have a plan. Plan the trade and trade the plan. Among other things, this includes setting a trigger level, a target area and a stop-loss level. It is also important to plan for three possible price movements: advance, decline or sideways. Have a plan for all three scenarios BEFORE making the trade. Consider possible holding times. And finally, look at overall market conditions and sector/industry performance.

