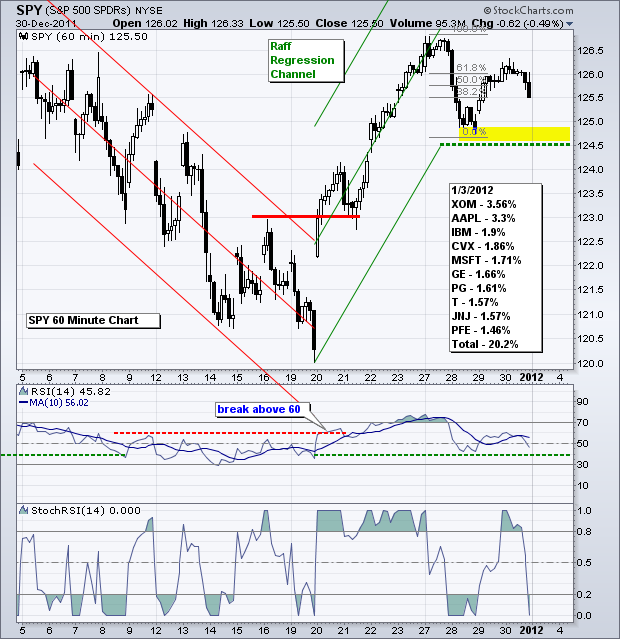
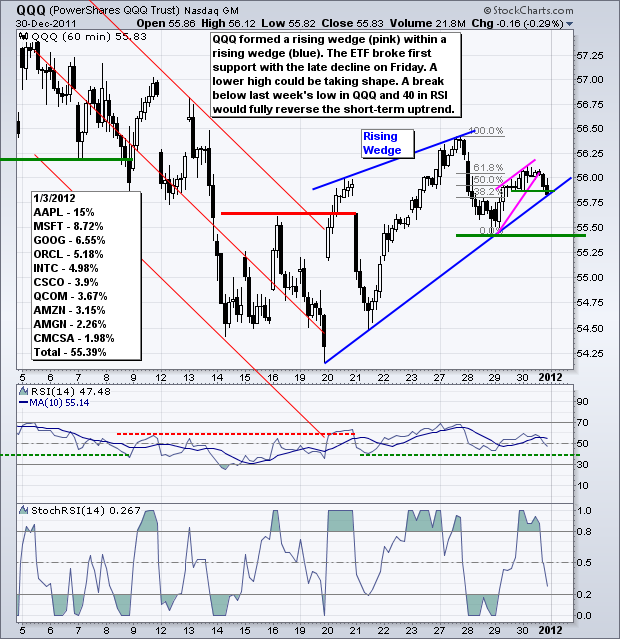
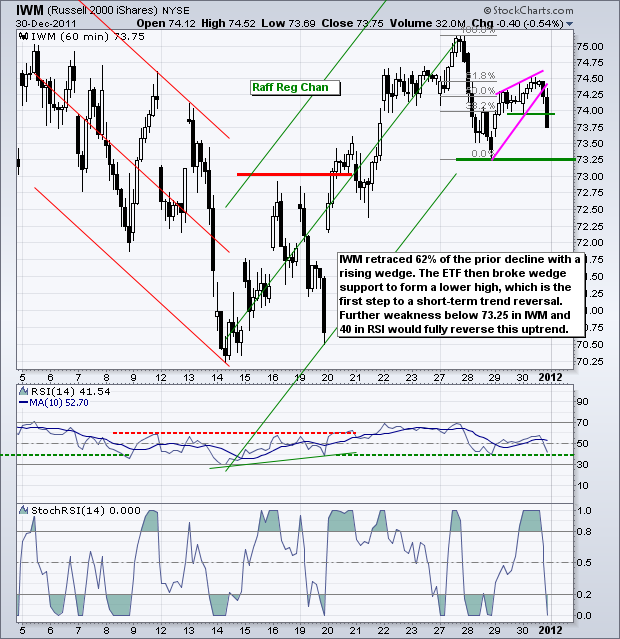
It is a short, but packed week for the market with several key economic reports on deck. We have ISM Manufacturing and FOMC minutes on Tuesday, Factory Orders and Auto/Truck Sales on Wednesday, ISM Services and Jobless Claims on Thursday, and the big Employment Report on Friday. The first trading week of 2012 will be anything but dull. On the price charts, the major index ETFs are bumping up against resistance from the October-November-December highs. SPY was turned back in the 126-128 area at least three times in the prior three months. The ETF finished 2011 near 126 and will start the year with another resistance challenge. On the 60-minute chart, the short-term trend is up with key support at 124.50, the late December low. The ETF hit resistance near the 61.80% retracement on Friday and closed weak. While I do not want to make too much out of a sell off in the final two hours of trading in 2011, this lower high is the first sign of a trend reversal. A break below 124.50 in SPY and 40 in RSI would fully reverse the short-term uptrend. Such a reversal would mark another failure at the bigger resistance zone extending back to late October.
**************************************************************************
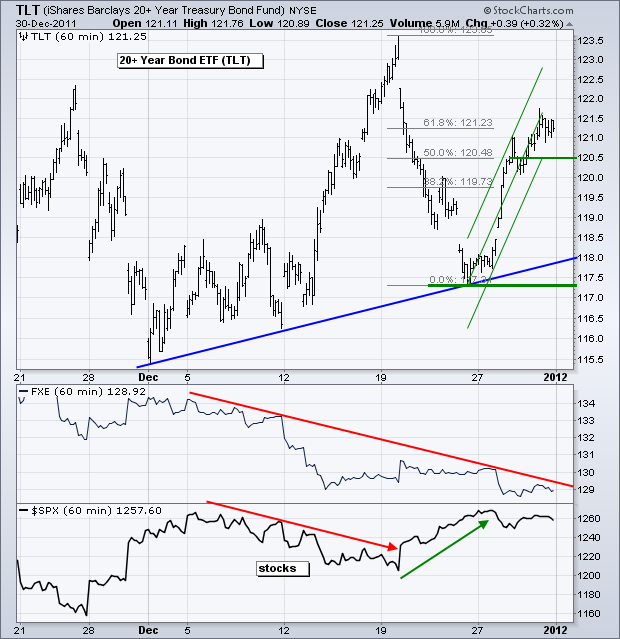
The 20+ Year T-Bond ETF (TLT) finished 2011 with a bang by surging back above 121 last week. Overall, the big trend is up with a higher high on 19-Dec and higher low a few days later. The fate of TLT is likely tied to the Euro and the stock market. Weakness in both would push money into Treasuries as a safe-haven, while strength in both would trigger selling pressure. Last week's steep advance retraced 61.80% of the prior decline and this area may provide some resistance. I am using the Raff Regression Channel to mark first support at 120.50. A move below this level would provide the first sign of weakness.
**************************************************************************
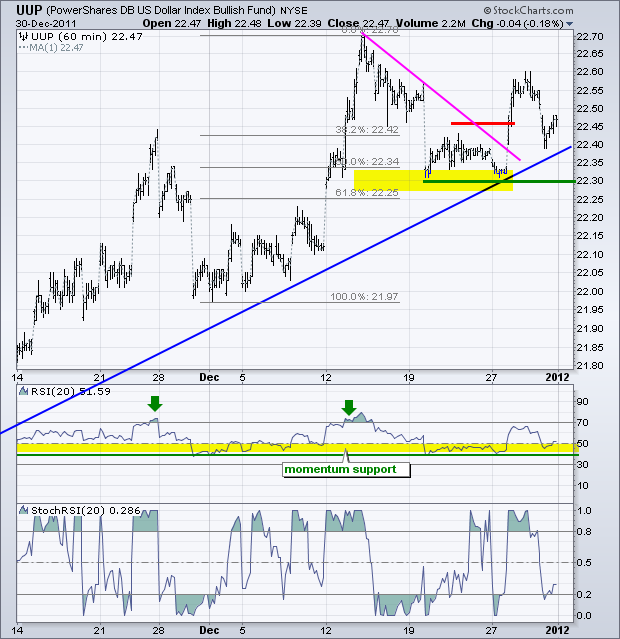
The US Dollar Fund (UUP) remains in an uptrend overall with key support in the 22.30 area. The ETF bounced along this level towards the end of December and then broke resistance with a surge above 22.50 last week. The breakout was challenged with a throwback, but it is largely holding. RSI is also holding its support zone. Look for a break below 22.30 in UUP and 40 in RSI to reverse the short-term uptrend.
**************************************************************************
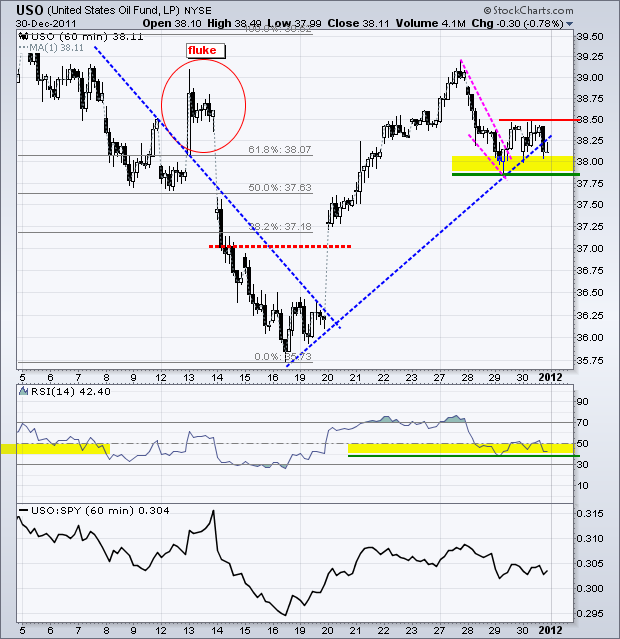
The US Oil Fund (USO) is catching a bid this morning as tensions flare between the US and Iran. What else is new? USO pulled back rather sharply last week, but found support around 38 and firmed the last two days. Last week's low marks key support and a break would be bearish, as would an RSI break below 40. The ETF established resistance at 38.50 with a consolidation the last two days and a break above this level would extend the uptrend in oil.
**************************************************************************
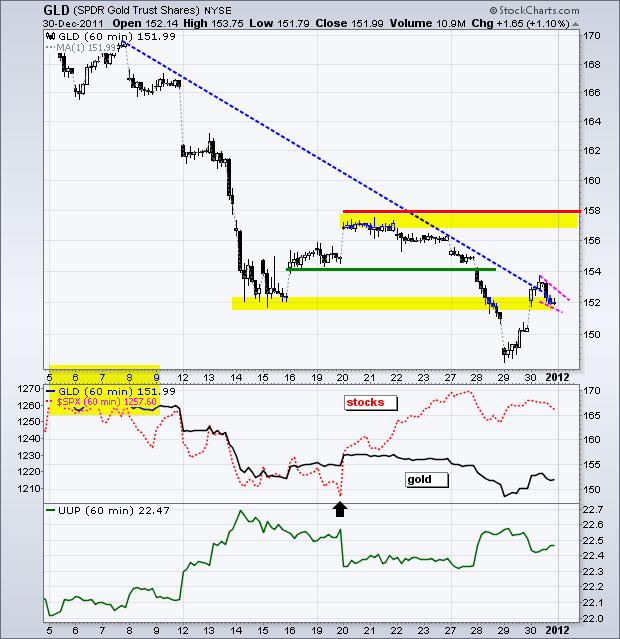
Gold is moving higher in early trading as the Euro bounced back above 1.30 early Tuesday. This means UUP is poised for a support test this morning. Gold seems to be taking most of its cues from the Dollar and continues to show an inverse correlation. After plunging below 150 last week, GLD surged back above 152 with a strong move. Friday's decline formed a small falling pennant and a break above 153 would signal a continuation higher. Such a move would target further strength towards the next resistance zone around 156-158.
**************************************************************************
Key Economic Reports:
Tue - Jan 03 - 10:00 - ISM Manufacturing Index
Tue - Jan 03 - 10:00 - Construction Spending
Tue - Jan 03 - 14:00 - FOMC Minutes
Wed - Jan 04 - 07:00 - MBA Mortgage Index
Wed - Jan 04 - 10:00 - Factory Orders
Wed - Jan 04 - 14:00 - Auto/Truck Sales
Thu - Jan 05 - 07:30 - Challenger Job Cuts
Thu - Jan 05 - 08:15 - ADP Employment Report
Thu - Jan 05 - 08:30 - Jobless Claims
Thu - Jan 05 - 10:00 - ISM Services Index
Thu - Jan 05 - 11:00 - Oil Inventories
Fri - Jan 06 - 08:30 - Employment Report
Charts of Interest: Tuesday and Thursday in separate post.
This commentary and charts-of-interest are designed to stimulate thinking. This analysis is not a recommendation to buy, sell, hold or sell short any security (stock ETF or otherwise). We all need to think for ourselves when it comes to trading our own accounts. First, it is the only way to really learn. Second, we are the only ones responsible for our decisions. Think of these charts as food for further analysis. Before making a trade, it is important to have a plan. Plan the trade and trade the plan. Among other things, this includes setting a trigger level, a target area and a stop-loss level. It is also important to plan for three possible price movements: advance, decline or sideways. Have a plan for all three scenarios BEFORE making the trade. Consider possible holding times. And finally, look at overall market conditions and sector/industry performance.

