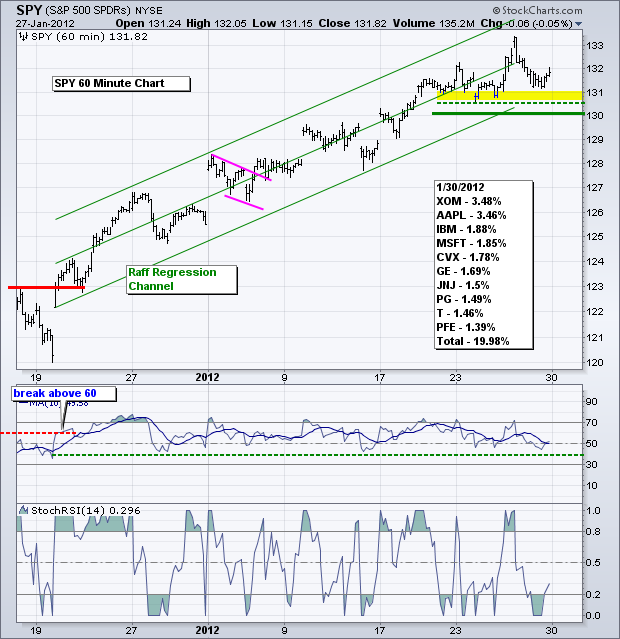
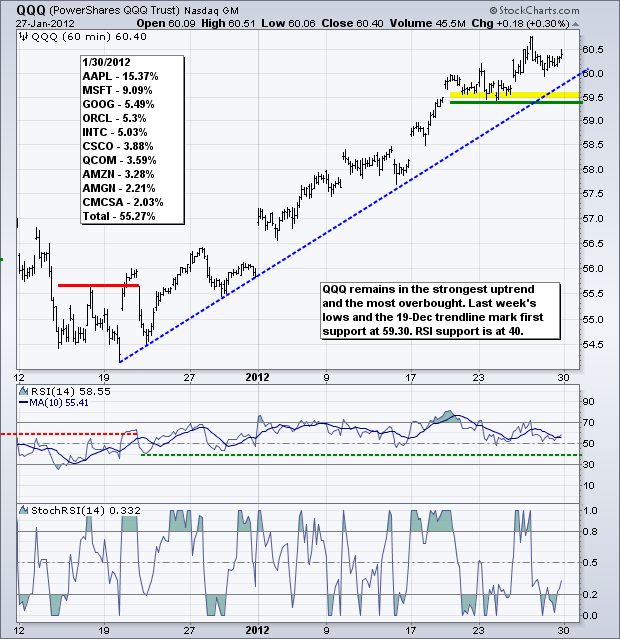
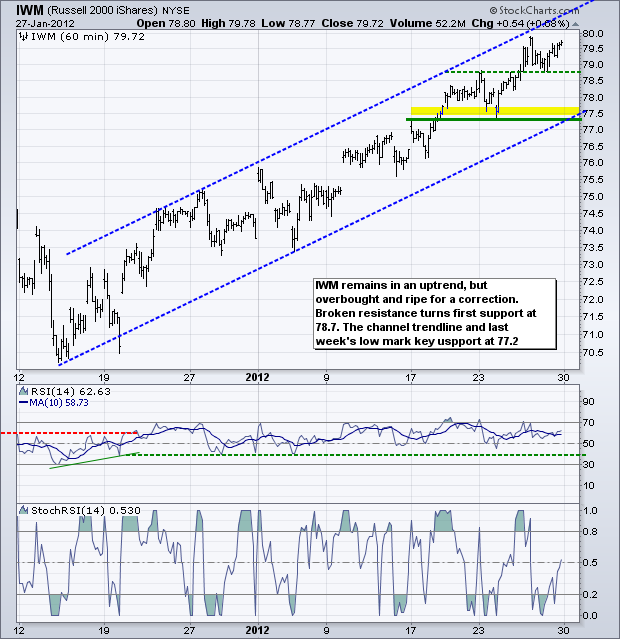
Even though the short-term uptrends remain in place, the major index ETFs are overbought and ripe for a correction. Corrections can evolve as pullbacks or sideways trading ranges. A pullback that retraces around 50% of the prior advance (19-Dec to 26-Jan) might be playable for a short-term trader. A sideways trading range, however, would be more complicated. Such a range might involve a break below support and then a bounce back towards the prior high. New support and resistance would then evolve as the range unfolds. Selling short on the first support break after an extended uptrend can be dangerous. On the SPY chart, I am marking key support at 130. Support in the 130-131 zone stems from the Raff Regression Channel, last week's low and a small buffer. While a break below this support zone would reverse the short-term uptrend, I am concerned that residual demand would trigger a pretty good bounce after such a support break. Not everyone played this rally. Those who missed out may view pullbacks as buying opportunities and this could make for a trading range the next few weeks. RSI support is set at 40. Before moving further, note that it is a very heavy week for economic reports. Stocks are priced for some good news. Any disappointments could be dealt with in a harsh manner.
**************************************************************************
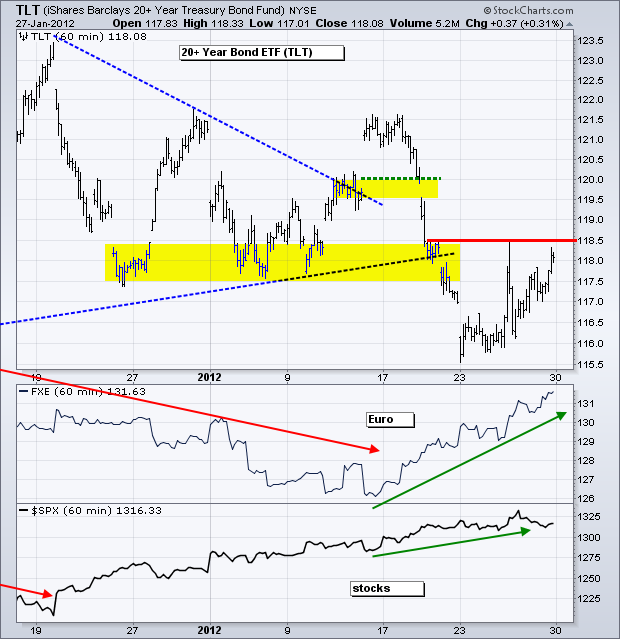
Despite a weak open on Monday and some wild gyrations around the Fed policy statement, the 20+ Year T-Bond ETF (TLT) actually had a good week. TLT opened below 116 and closed above 118. This was unexpected because the Euro continued strong and stocks held up last week. Treasuries, which represent the safe-haven play, could be hinting that the Euro and stock market are vulnerable. TLT resistance remains at 118.50 and a break above this level would reverse the short-term downtrend.
**************************************************************************
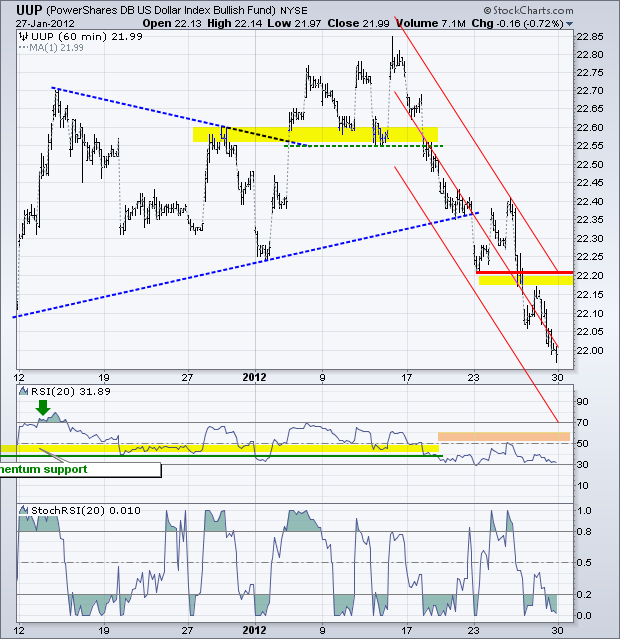
The US Dollar Fund (UUP) took quite the hit over the last two weeks and remains seriously oversold. This is a big week for the Euro because the EU heads of state are meeting in Brussels today. Yes, it is another summit with Greek debt the hot topic of debate. Turning back to the chart, the Raff Regression Channel, broken support and Thursday's high mark key resistance at 22.30. RSI resistance is set at 60. Look for breaks above these levels to reverse the short-term downtrend.
**************************************************************************
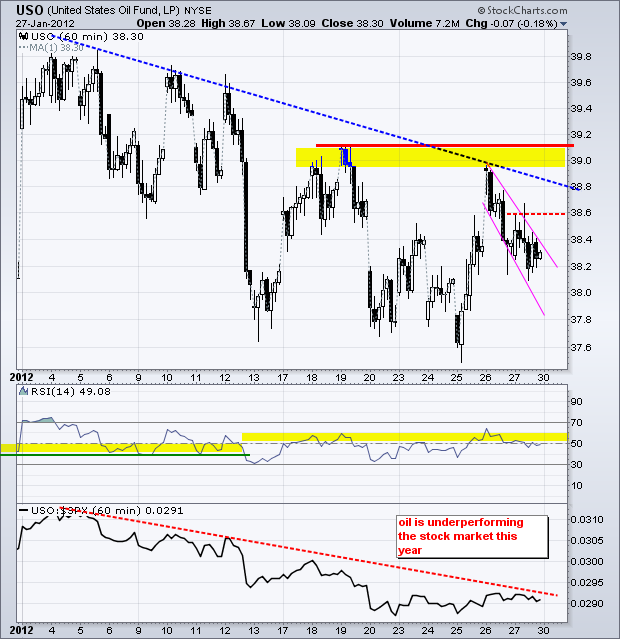
The US Oil Fund (USO) remains in a downtrend this year with a series of lower lows and lower highs. Last week's surge above 38.6 was impressive, but fell just short of a convincing breakout. With a falling flag taking shape the last two days, traders should watch for a break above 38.6 to signal a continuation of last week's surge. RSI resistance is set at 60.
**************************************************************************
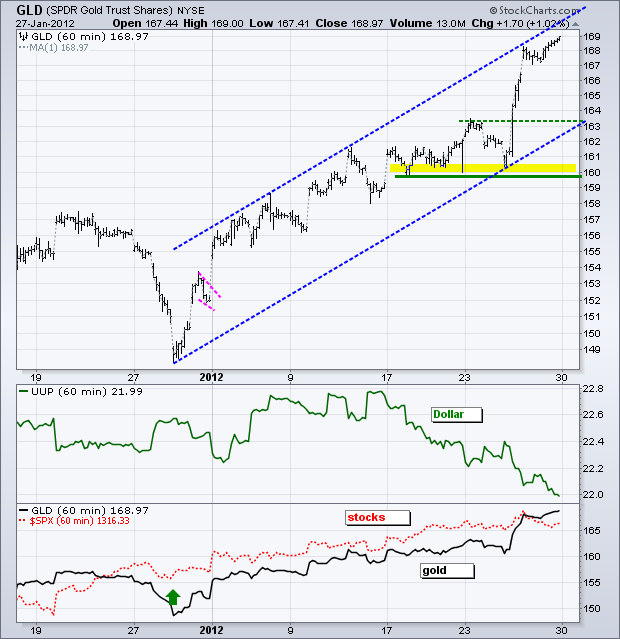
The Gold SPDR (GLD) is up some 13% from its late December low (±149). Even though the ETF is overbought, there are simply no signs of weakness. GLD surged above 169 last week, held its gains and closed at the high for the week. As noted last week, gold is the un-currency and continues to attract money as an alternative to the Euro and Dollar. Broken resistance and the late December trendline mark first support at 163. Key support remains at 160 for now.
**************************************************************************
Key Economic Reports:
Mon - Jan 30 – 08:00 – EU Heads of State Meeting
Mon - Jan 30 – 08:00 – Italian Medium and Long Term Bond Auction
Mon - Jan 30 - 08:30 - Personal Income & Spending
Tue - Jan 31 - 09:00 - Case-Shiller Housing Index
Tue - Jan 31 - 09:45 - Chicago PMI
Tue - Jan 31 - 10:00 - Consumer Confidence
Wed - Feb 01 - 07:00 - MBA Mortgage Index
Wed - Feb 01 - 08:15 - ADP Employment Report
Wed - Feb 01 - 10:00 - ISM Manufacturing Index
Wed - Feb 01 - 10:00 - Construction Spending
Wed - Feb 01 - 10:30 - Oil Inventories
Wed - Feb 01 - 14:00 – Auto/Truck Sales
Thu - Feb 02 - 07:30 - Challenger Job Cuts
Thu - Feb 02 - 08:30 - Jobless Claims
Fri - Feb 03 - 08:30 – Employment Report
Fri - Feb 03 - 10:00 - Factory Orders
Fri - Feb 03 - 10:00 - ISM Services
Charts of Interest: Tuesday and Thursday in separate post.
This commentary and charts-of-interest are designed to stimulate thinking. This analysis is not a recommendation to buy, sell, hold or sell short any security (stock ETF or otherwise). We all need to think for ourselves when it comes to trading our own accounts. First, it is the only way to really learn. Second, we are the only ones responsible for our decisions. Think of these charts as food for further analysis. Before making a trade, it is important to have a plan. Plan the trade and trade the plan. Among other things, this includes setting a trigger level, a target area and a stop-loss level. It is also important to plan for three possible price movements: advance, decline or sideways. Have a plan for all three scenarios BEFORE making the trade. Consider possible holding times. And finally, look at overall market conditions and sector/industry performance.


