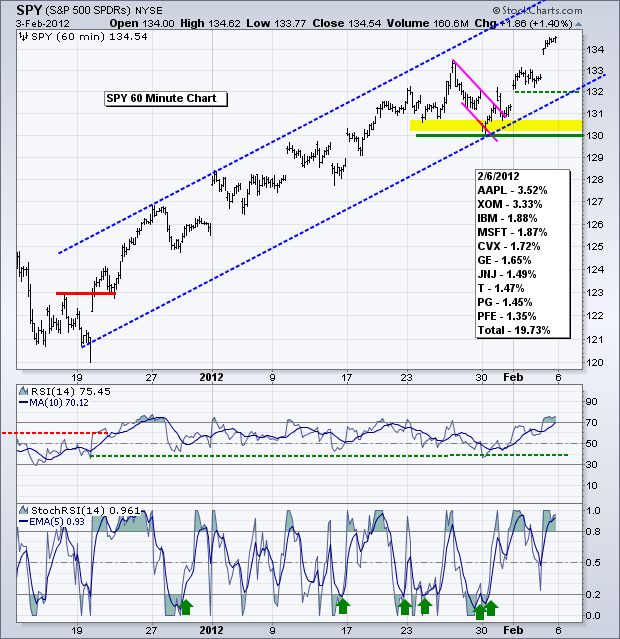
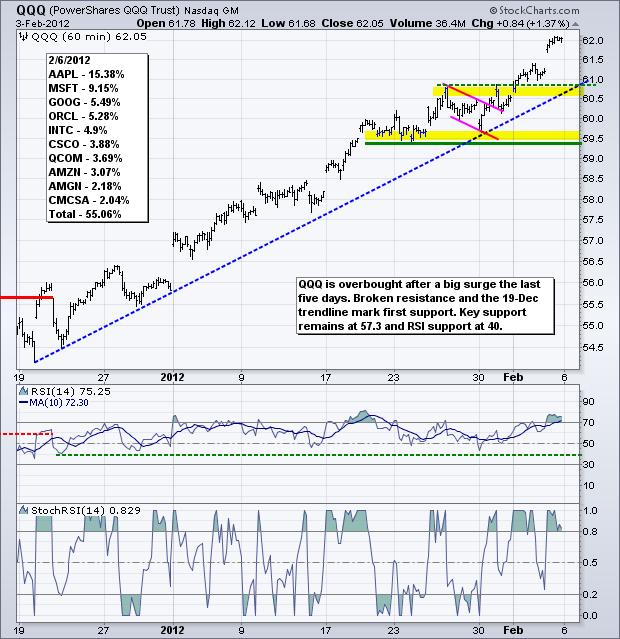
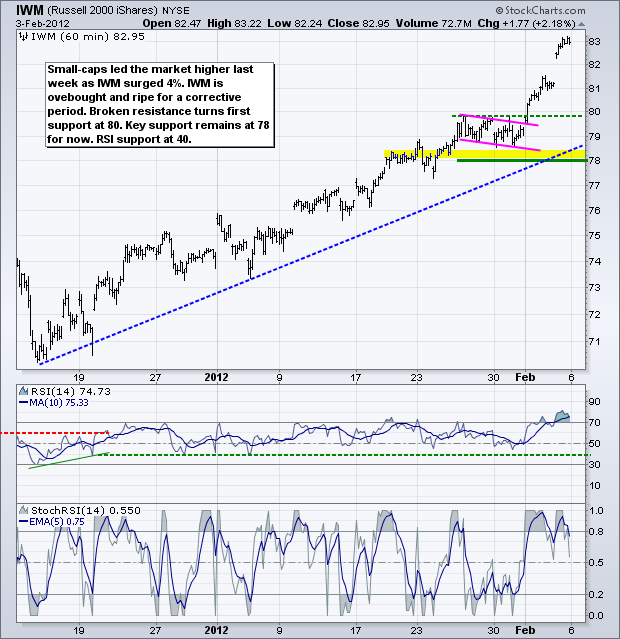
Stocks extended their short-term uptrends with strong moves on Friday. SPY, QQQ and IWM all hit new highs for the move and the short-term uptrends are now entering their eighth week. These moves started with a gap and breakout on December 19th. Overall, stocks are still quite overbought and ripe for a correction or consolidation. This has been the case for at least two weeks though. Nevertheless, traders need to be on guard for a corrective period. Market focus may turn to Europe this week because the economic docket is quite light in the US. Negotiations for a Greek bailout continue this week, spreads for Portuguese bonds are widening and the European Central Bank (ECB) makes a policy statement on Thursday. On the S&P 500 ETF (SPY) chart, the ETF gapped up for the second time in three days and held both gaps. Perhaps this was a buying climax as the bears capitulated. However, these gaps are bullish as long as they hold. Broken resistance, Friday's gap and the 19-Dec trendline combine to mark first support at 132. Key support remains at 130 and RSI support at 40.
**************************************************************************
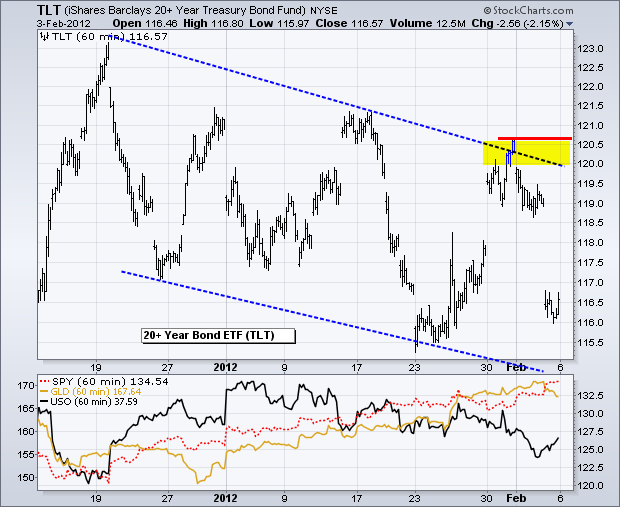
After a short period of positive correlation, stocks and treasuries quickly reverted to a negative correlation Wednesday through Friday. Strong economic reports pushed stocks sharply higher and treasuries sharply lower on Friday. Overall, the 20+ Year T-Bond ETF (TLT) has been trending lower with a big zigzag down he last seven weeks. The counter trend rallies within this downtrend have been sharp, but each one formed a lower high and lower low. Key resistance is set in the 120-120.5 area.
**************************************************************************
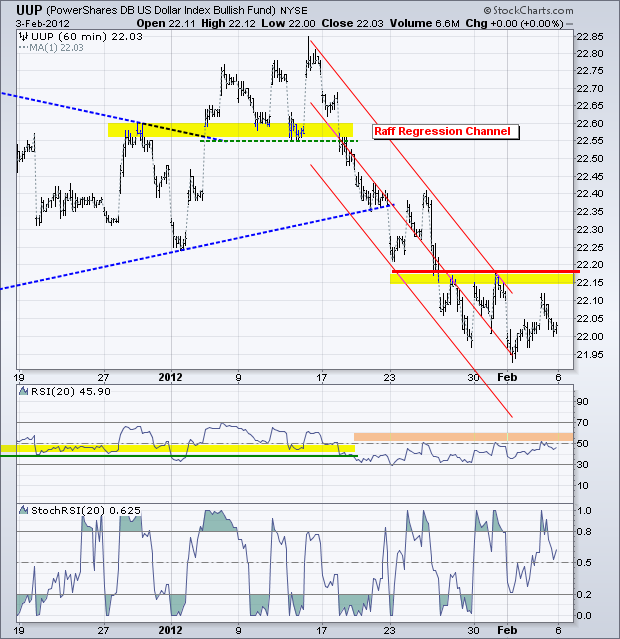
The US Dollar Fund (UUP) remains in a downtrend overall, but the decline slowed as the ETF traded between 21.9 and 22.18 the last several days. Even though the trend has yet to reverse, signs of firmness are the first step. Also keep in mind that the bigger trend for the Dollar is up and the Euro will be in focus this week as Greek talks reach a crescendo and the European Central Bank (ECB) makes its policy statement on Thursday. I am still watching resistance in the 22.20 area and RSI resistance at 60 for a breakout.
**************************************************************************
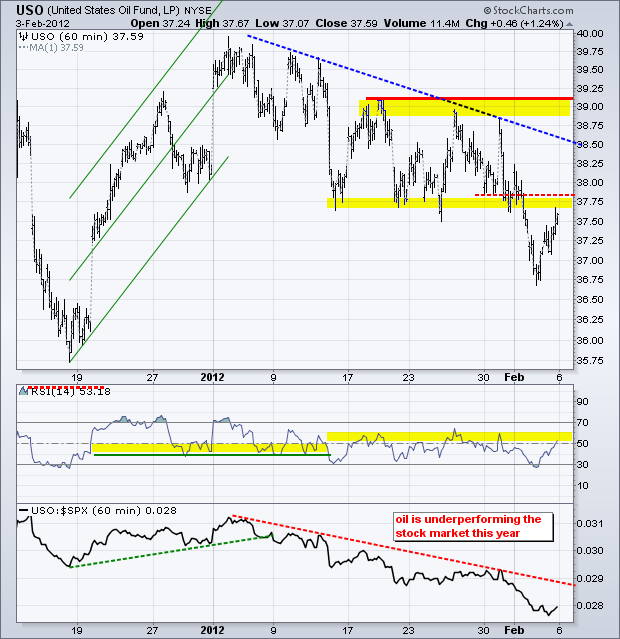
The US Oil Fund (USO) bounced along with the stock market on Friday, but remains in a downtrend overall and continues to underperform the S&P 500. The trend since January is down with a series of lower lows and lower highs. Key resistance is set in the 39 area. Broken support in the 37.75 area turns into the first resistance zone to watch. RSI resistance remains in the 50-60 zone.
**************************************************************************
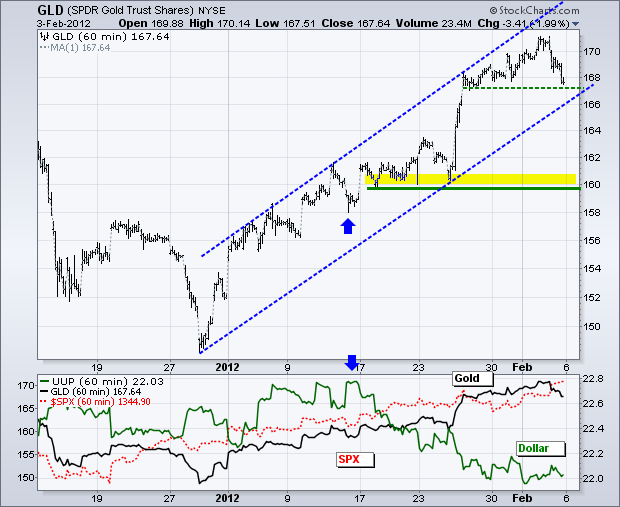
Gold divorced the stock market on Friday and resumed its negative correlation with the Dollar. Technically, gold and the Dollar have been moving in opposite directions since January 13th, which is when the Dollar peaked. Perhaps an extended bounce in the Dollar would weigh on gold, which is overbought and ripe for a correction. The late December trendline and last week's lows mark first support around 167. Below this level, the next support zone is in the 160-162 area.
**************************************************************************
Key Economic Reports:
Mon - Feb 06 - 08:00 – Greek Debt Negotiations Continue
Tue - Feb 07 - 08:00 – General Strike in Greece
Tue - Feb 07 - 10:00 – Bernanke Testifies before Congress
Wed - Feb 08 - 07:00 - MBA Mortgage Index
Wed - Feb 08 - 10:30 - Oil Inventories
Thu - Feb 09 - 08:30 - Jobless Claims
Thu - Feb 09 - 08:00 – European Central Bank Policy Statement
Fri - Feb 10 - 09:55 - Michigan Sentiment
Charts of Interest: Tuesday and Thursday in separate post.
This commentary and charts-of-interest are designed to stimulate thinking. This analysis is not a recommendation to buy, sell, hold or sell short any security (stock ETF or otherwise). We all need to think for ourselves when it comes to trading our own accounts. First, it is the only way to really learn. Second, we are the only ones responsible for our decisions. Think of these charts as food for further analysis. Before making a trade, it is important to have a plan. Plan the trade and trade the plan. Among other things, this includes setting a trigger level, a target area and a stop-loss level. It is also important to plan for three possible price movements: advance, decline or sideways. Have a plan for all three scenarios BEFORE making the trade. Consider possible holding times. And finally, look at overall market conditions and sector/industry performance.

