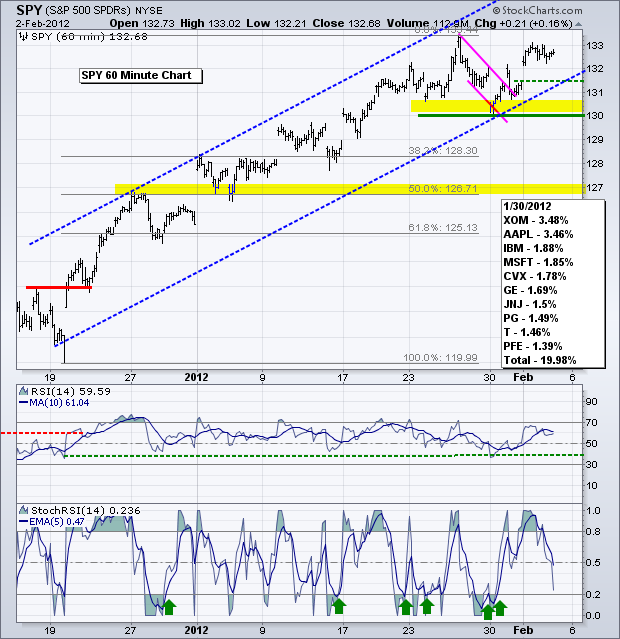
And now for the Employment Report....and Factory Orders....and ISM Services. This is like the golden trio of economic reports. In one day we will cover employment, manufacturing and services. Stocks are overbought. Treasuries are at resistance and well above their late January lows. The Dollar is oversold after a sharp three week decline. The market's reactions to today's reports could shake up the situation – for the short-term at least. There is no real change on the charts. The S&P 500 ETF (SPY) broke flag resistance on Tuesday morning and extended its gains on Wednesday. This surge reinforces key support at 130. A move below this level and an RSI break below 40 would reverse the short-term uptrend. Those looking for a quicker signal can watch the gap/breakout and December trendline at 131.50. A move back below this level would fill the gap and negate the flag breakout. A little caution is advised because it is very possible that stocks move into a trading range type correction instead of a pullback type correction.


