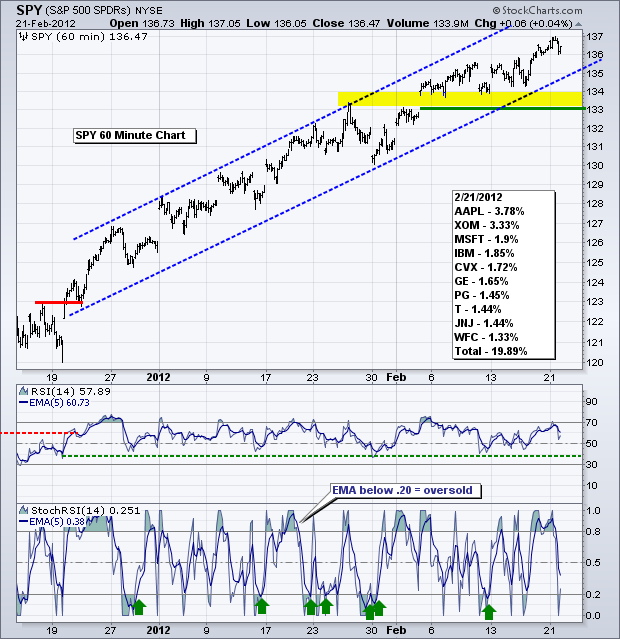
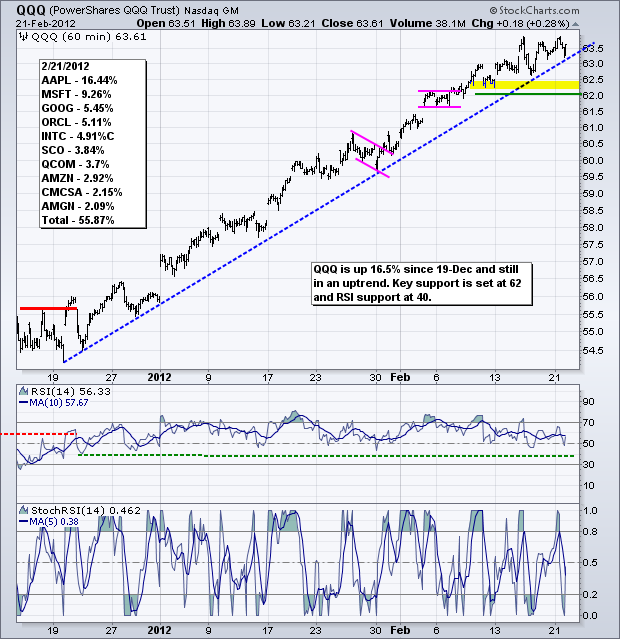
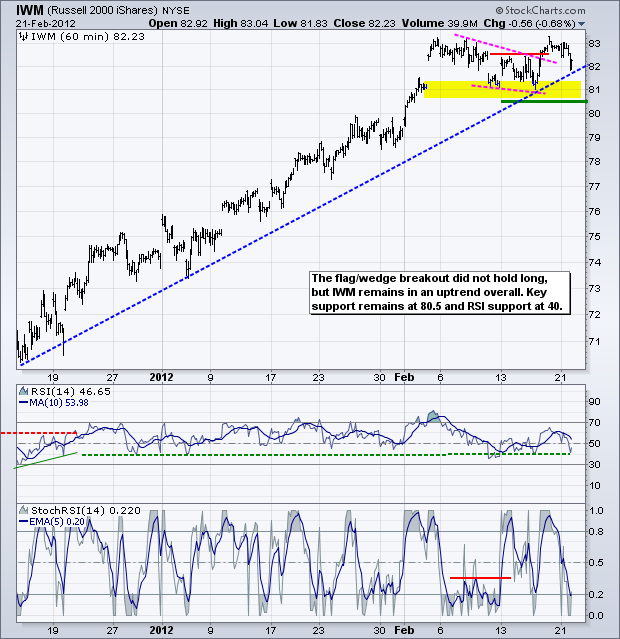
Even though the major index ETFs remain in uptrends, signs of weakness are emerging under the hood and stocks are ripe for a corrective period. First, small-caps continue to show relative weakness since 3-Feb, which is when IWM peaked. Second, sentiment remains overtly bullish as the 10-day SMA of the CBOE Total Put/Call Ratio ($CPC) moved to levels not seen since April 2011. Third, stocks are overbought after a sharp advance the last 9-10 weeks. Short-term, I think the time for new long positions has past, however, it may still be too early to consider short positions. While a support break would reverse the uptrend, be careful because those who missed the rally could take advantage of the first dip. On the SPY chart, broken resistance and the 3-Feb gap turn into the first support zone around 133-134. This level held the last two weeks as SPY edged higher with a zigzag above 136. RSI moved above 60 on 19-Dec and has held its bull zone (40-80) for nine weeks. This uptrend remains in place until SPY breaks 133 and RSI breaks 40.
**************************************************************************
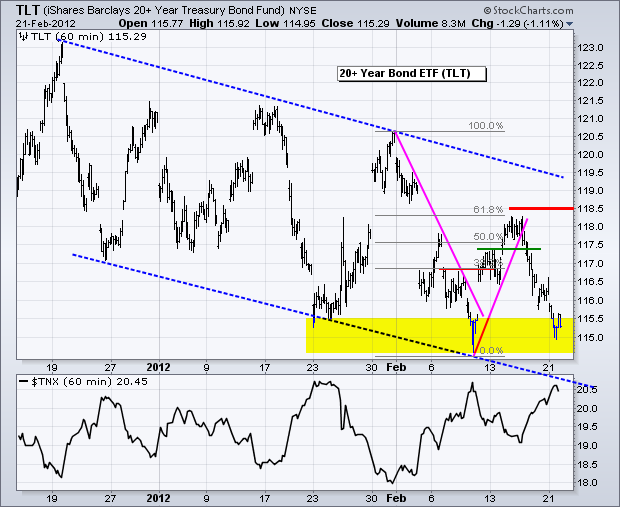
With oil surging, gold breaking out, and stocks trading near their highs for the year, it is little wonder that treasuries are weak. Overall, the 20+ Year T-Bond ETF (TLT) remains in a downtrend since 19-Dec with a big zigzag lower. There is perhaps support in the 115 area from the lows since late January. Also notice that the 10-year Treasury Yield ($TNX) is running into possible resistance near 2.07% (20.7 on the chart). Weakness in oil, stocks and the Euro is likely needed for a sustainable advance in treasuries. Key resistance remains at 118.5 for now.
**************************************************************************
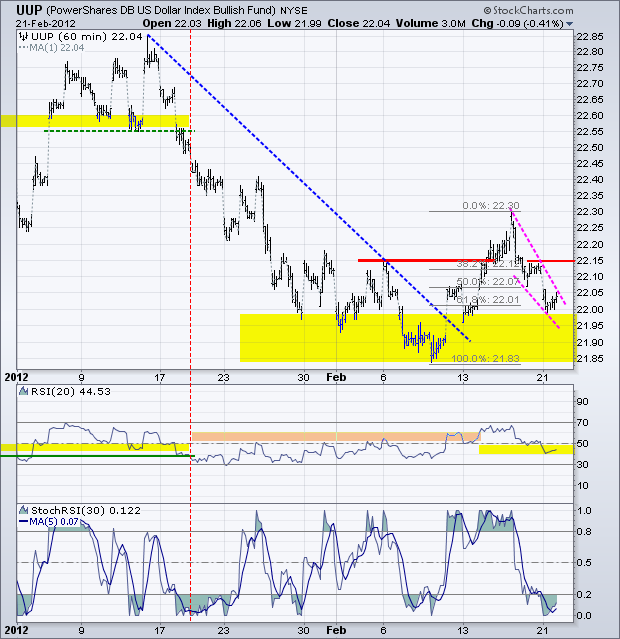
Even though the Euro surged over the last two days, I was not that impressed with the move. EU finance ministers approved a 116 billion Euro package for Greece to make its 14.5 billion Euro bond payment on 20-March. Greece's total debt amounts to around 350 billion Euros. While I do not know all the details, it seems that 130 billion Euros will buy quite a bit of time for Greece. Even so, the Euro could remain under pressure because the European Central Bank (ECB) is doing its version of quantitative easing and the next LTRO round is scheduled for 29-Feb. This dilutes the Euro and will likely put a cap on any gains in the currency. Moreover, the European Central Bank (ECB) would rather see a weak Euro to stimulate export growth and the EU economy. On the price chart, the US Dollar Fund (UUP) remains above its early February low as the current decline retraced 61.80% of the prior surge. Also notice that RSI is trading in the 40-50 zone, which marks support in an uptrend. A higher low and break above 22.15 would be bullish and argue for an extension of the bigger uptrends on the daily and weekly charts.
**************************************************************************
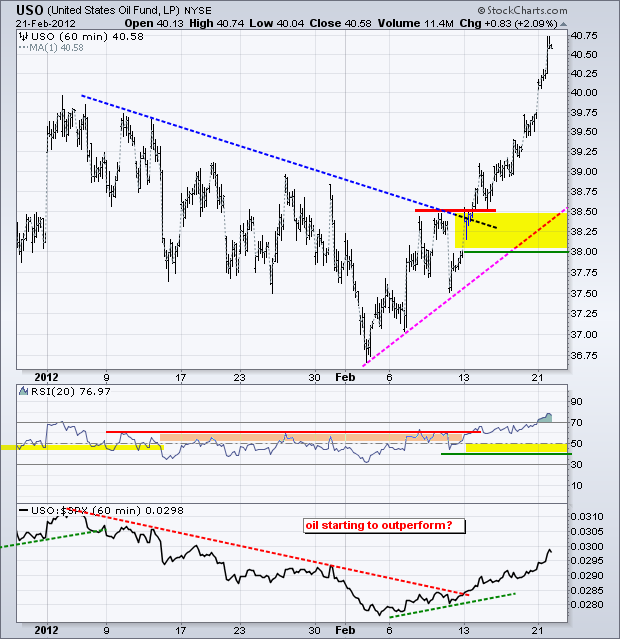
No change. Oil continues to surge with Brent Crude leading the global charge. The US Oil Fund (USO) broke resistance with a surge from 36.75 to 40.75 over the last three weeks. Oil is playing catch up with the stock market and also getting overbought, especially for the short-term. Note that the decline from early January to early February looks like a falling flag on the daily chart. The breakout at 38.50 signals a continuation of the December advance and broken resistance turns first support. RSI support is set at 40.
**************************************************************************
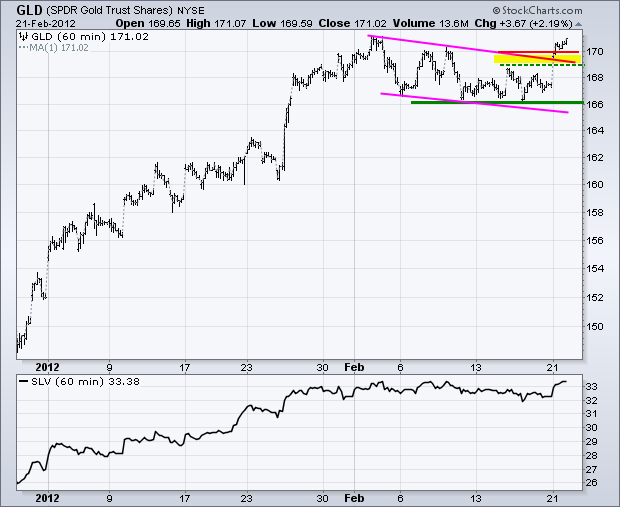
Gold has spoken with a surge above 170 and a falling flag breakout. After a 3-4 week correction, this move signals a continuation of the prior advance, which began in late January, or perhaps even in late December. Either way, the breakout point to higher prices for bullion. The move reinforces key support at 166. Broken resistance in the 169-170 area turns into the first support zone. The only concern here is that a breakout in the Dollar could de-rail the breakout in gold.
**************************************************************************
Key Economic Reports:
Wed - Feb 22 - 07:00 - MBA Mortgage Index
Wed - Feb 22 - 10:00 - Existing Home Sales
Thu - Feb 23 - 08:30 - Jobless Claims
Thu - Feb 23 - 11:00 - Oil Inventories
Fri - Feb 24 - 09:55 - Michigan Sentiment
Fri - Feb 24 - 10:00 - New Home Sales
Wed - Feb 29 – 08:00 - Second LTRO round for EU Banks
Wed – Feb 29 – 08:00 – Italian bond auction
Charts of Interest: Tuesday and Thursday in separate post.
This commentary and charts-of-interest are designed to stimulate thinking. This analysis is not a recommendation to buy, sell, hold or sell short any security (stock ETF or otherwise). We all need to think for ourselves when it comes to trading our own accounts. First, it is the only way to really learn. Second, we are the only ones responsible for our decisions. Think of these charts as food for further analysis. Before making a trade, it is important to have a plan. Plan the trade and trade the plan. Among other things, this includes setting a trigger level, a target area and a stop-loss level. It is also important to plan for three possible price movements: advance, decline or sideways. Have a plan for all three scenarios BEFORE making the trade. Consider possible holding times. And finally, look at overall market conditions and sector/industry performance.

