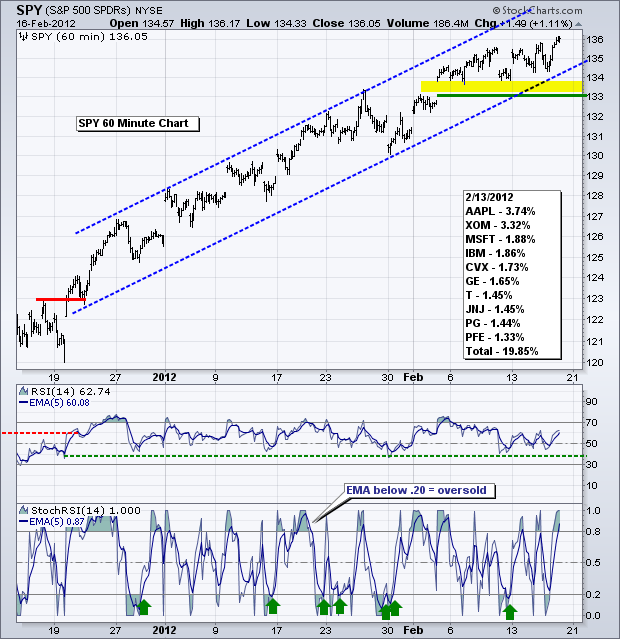
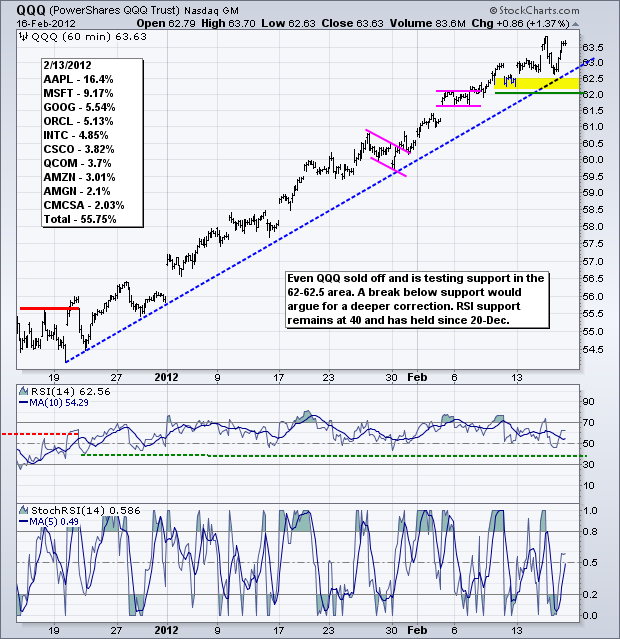
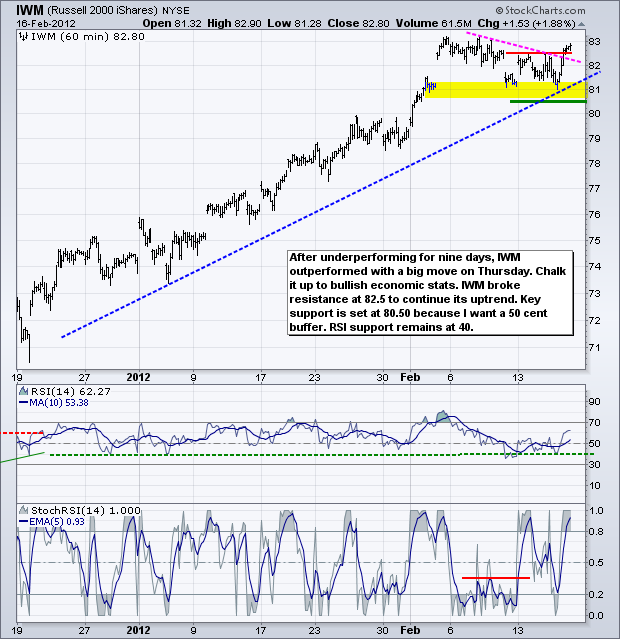
Stocks may seem overbought, sentiment may seem too bullish and the odds of a correction may seem high, but a pullback cannot materialize until there is a noticeable and sustainable increase in selling pressure. This means we need to see more than a day of selling pressure AND some sort of support break. We have seen short selling bouts, which appear to be based on European fears. However, these bouts soon turn into bounces as strong US economic numbers hit the tape. Notice how stocks swooned on Wednesday afternoon and then surged all day Thursday. Now we have a three day weekend ahead and EU finance ministers meet on Monday for the "final" vote on the Greek rescue package. Therefore, we can probably expect some fireworks on Tuesday morning. While EU-Greek brinkmanship may sway the US stock market short-term, I think the US economic outlook is the main driver for the US stock market. The Greek tragedy, while certainly important to Greece and the EU, is just a sideshow as far as US stocks are concerned. The S&P 500 ETF (SPY) remains in a clear uptrend and has been trending higher since the 19-Dec breakout. This strong two-month uptrend shows no signs of weakness or significant selling pressure. After breaking resistance with a gap above 134, the ETF consolidated as priced edged higher. I am setting short-term support at 133 and RSI support at 40. Notice how RSI traded in the 40-80 zone during the entire uptrend.
**************************************************************************
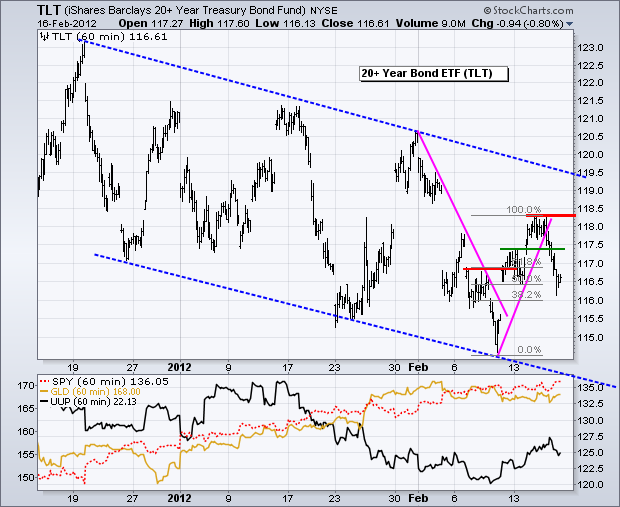
The 20+ Year T-Bond ETF (TLT) followed the Dollar lower on Thursday. Overall, TLT remains in a downtrend. The most recent upswing within that downtrend hit resistance at the 61.80% retracement and the ETF broke first support at 117.40 with a sharp decline. This reinforces resistance from this week's high (118.30). Treasuries are likely to continue taking their cues from the Dollar. A strong Dollar and weak Euro would be bullish, while a weak Dollar and strong Euro would be bearish.
**************************************************************************
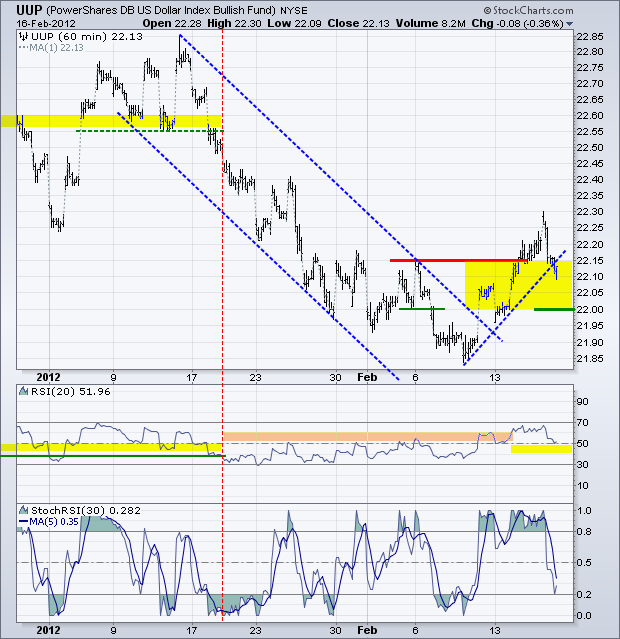
The US Dollar Fund (UUP) moved back below its resistance break with a rather sharp decline on Thursday. This is a challenge, but the ETF was short-term overbought after a sharp 4-day advance. I am going to mark a support zone in the 22-22.15 area to absorb some expected volatility in the coming days. A move below 22 would completely negate the breakout and be bearish. RSI is nearing its support zone in the 40-50 area and a break back below 40 would be momentum bearish.
**************************************************************************
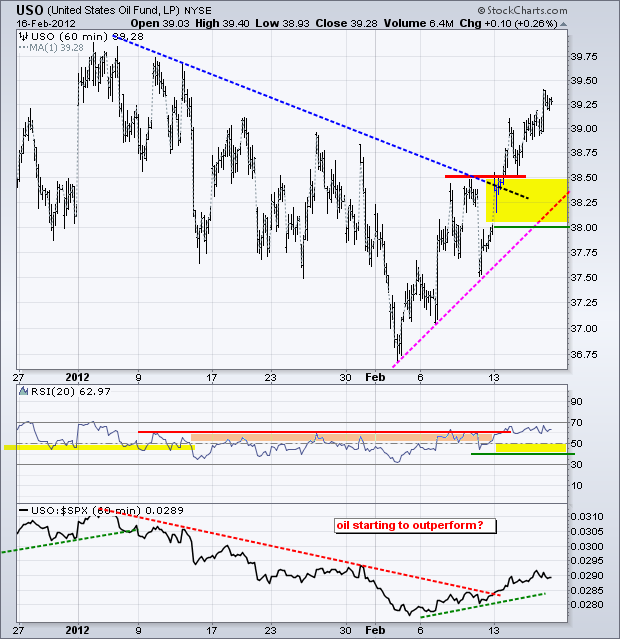
No change. The US Oil Fund (USO) extended it advance and closed above 39.25. There is a medium-term breakout in the works this week, but the ETF is getting short-term overbought after a run from 36.75 to 39.28 the last nine days. Broken resistance and the early February trendline combine to mark first support in the 38-38.5 area. RSI support is set at 40.
**************************************************************************
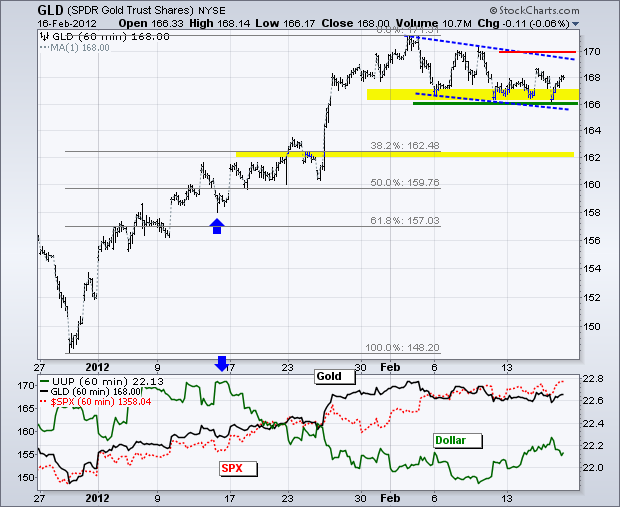
Gold opened weak, but recovered after the Dollar moved lower and stocks moved higher. Gold's positive correlation with stocks and negative correlation with the Dollar worked well after the open. The Gold SPDR (GLD) remains in a three week downtrend with a falling flag taking shape this month. The ETF is consolidating in the bottom half of this flag with choppy price action. I give the bulls an edge as long as support at 166 holds.
**************************************************************************
Key Economic Reports:
Fri - Feb 17 - 08:30 - Consumer Price Index (CPI)
Fri - Feb 17 - 10:00 - Leading Indicators
Mon - Feb 20 – 08:00 - EU finance ministers meet in Brussels
Charts of Interest: Tuesday and Thursday in separate post.
This commentary and charts-of-interest are designed to stimulate thinking. This analysis is not a recommendation to buy, sell, hold or sell short any security (stock ETF or otherwise). We all need to think for ourselves when it comes to trading our own accounts. First, it is the only way to really learn. Second, we are the only ones responsible for our decisions. Think of these charts as food for further analysis. Before making a trade, it is important to have a plan. Plan the trade and trade the plan. Among other things, this includes setting a trigger level, a target area and a stop-loss level. It is also important to plan for three possible price movements: advance, decline or sideways. Have a plan for all three scenarios BEFORE making the trade. Consider possible holding times. And finally, look at overall market conditions and sector/industry performance.

