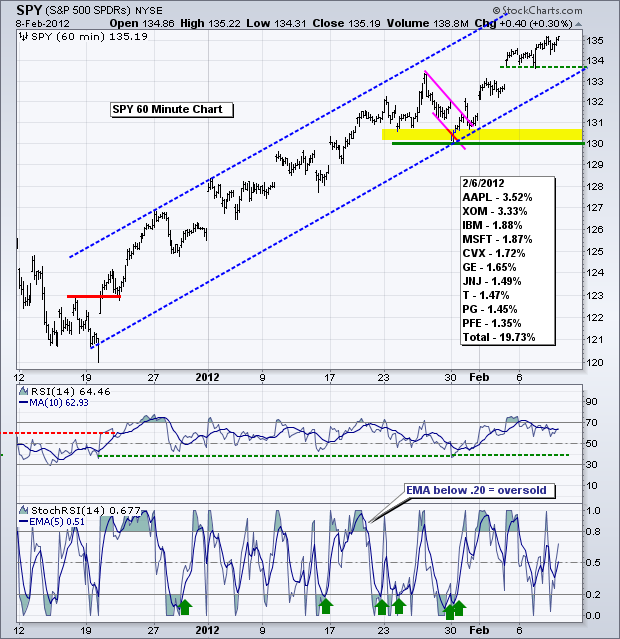
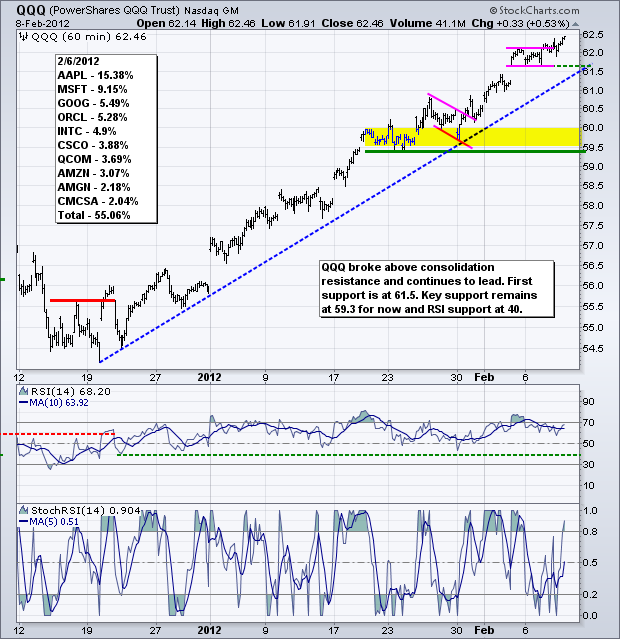
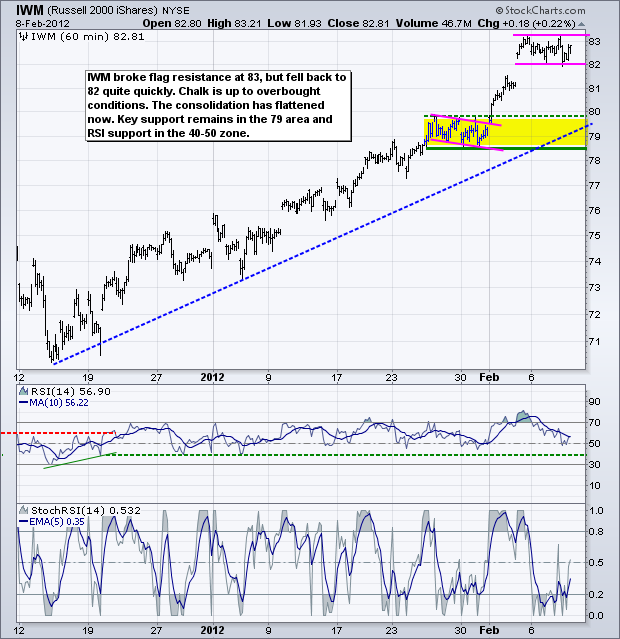
The bulls are piling on. While we can never be sure when exactly it happened, note that Nouriel Roubini, aka Dr. Doom, recently turned bullish. In fact, his director of equity and allocation strategy, Gina Sanchez, suggested that the current rally could extend for months. However, Roubini is looking for a downturn in the second half of 2012. Even though he may be a little late to the party, Roubini reasons that easy money from the Fed, European Central Bank and other central banks will keep the rally afloat. I would also hazard a guess that the ECB's Long-Term Refinancing Operation (LTRO) is lifting banks in Europe and the US. This is just another form of QE. Note that the finance sector is the top performer for 2012. While free money will not completely solve the problem, it is certainly relieving the symptoms and providing fuel for the equity markets. There is no change on the price charts as stocks remain in strong uptrends. SPY gapped up on Friday and held its gap for four days now. The lows of the last four days mark first support. A break below this level could signal the start of a mini-pullback. Key support remains at 130 and RSI support at 40.
**************************************************************************
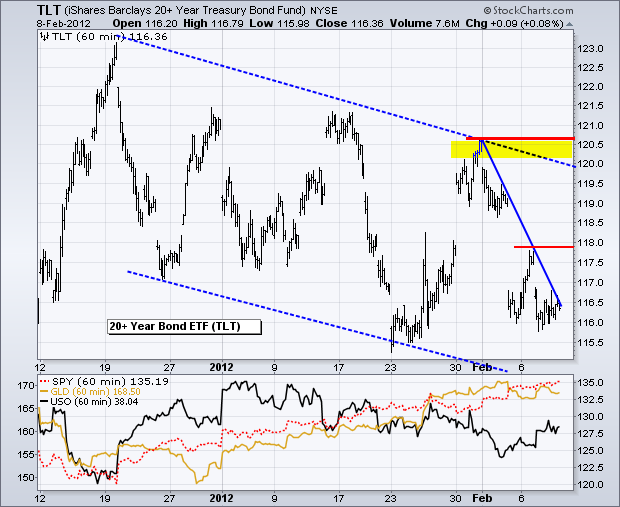
No change. The 20+ Year T-Bond ETF (TLT) remains in a downtrend since 19-December with a big zigzag lower. While this pattern looks like a falling flag on the daily chart, we have yet to see a surge off the recent low that would suggest a bigger breakout is in the works. The February trendline and Monday's high mark the first resistance level to watch. Fundamentally, strength in stocks and a breakout in the Euro are bearish for treasuries, which are viewed as safe-havens and part of the risk-off trade.
**************************************************************************
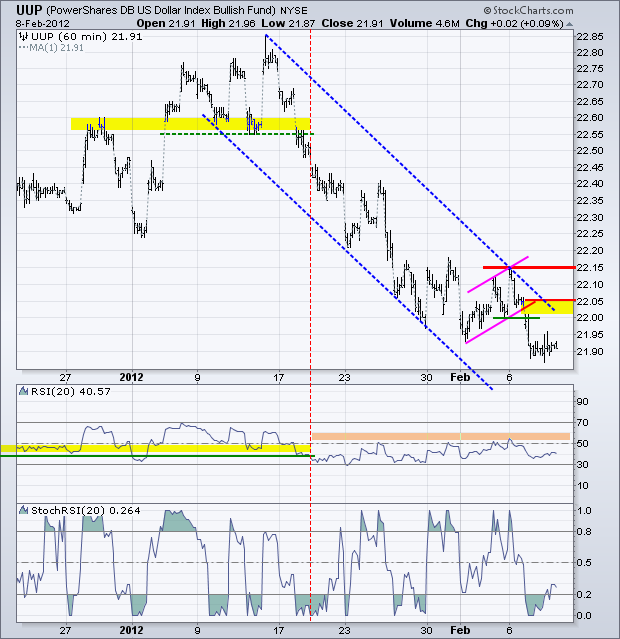
No change. With another surge in the Euro, the US Dollar Fund (UUP) broke flag support and moved to a new low for the year (2012). Broken support and the mid January trendline combine to mark first resistance at 22.05. A surge back above this level would negate the flag breakdown. Key resistance is set at 22.15 and RSI resistance at 60. A move above these levels is needed to fully reverse the downtrend.
**************************************************************************
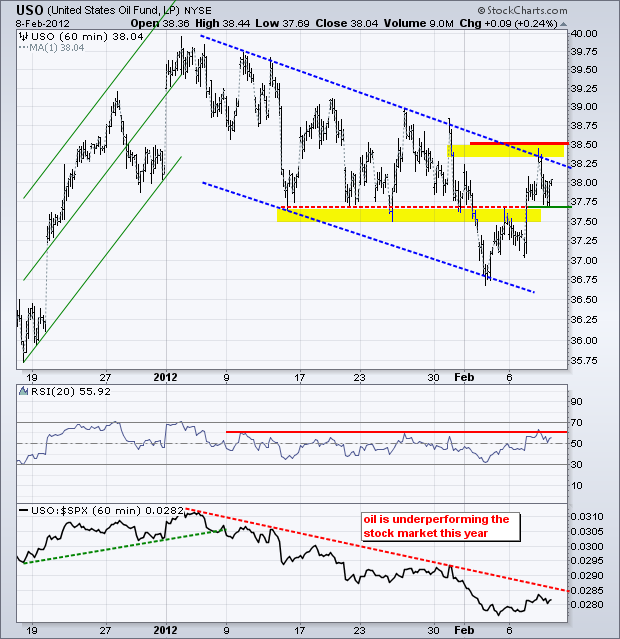
We could be at a make-or-break area for oil. The US Oil Fund (USO) surged back above broken support on Tuesday and RSI edged above 60 on Wednesday. The RSI breakout did not hold, but the surge above broken support did and the ETF established a minor support level at 37.65 with Wednesday's low. Yesterday's high now marks key resistance. Look for a break above this level to complete a trend reversal and signal a continuation of the late December surge.
**************************************************************************
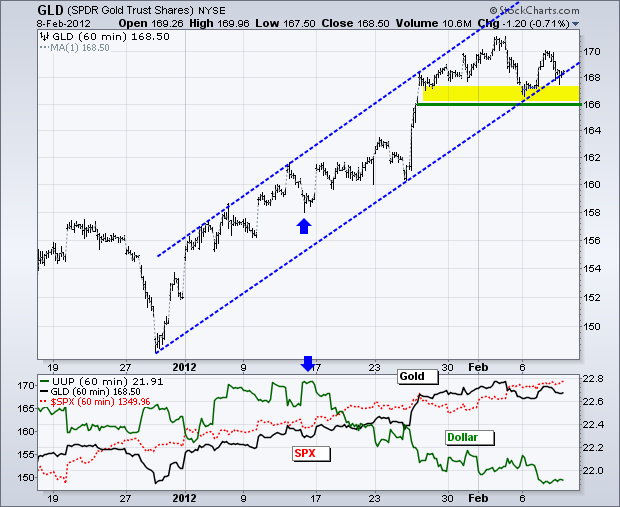
The Dollar firmed on Wednesday and gold took a hit. Nevertheless, bullion remains above first support and has yet to break down, just as the Dollar has yet to break out. Keep an eye on these two as the European Central Bank (ECB) meets today and Greek debt talks conclude. The lows of the last several days mark support in the 166-167 area. A break below this level would be short-term bearish and argue for an extended correction, possibly back to the 160-162 area.
**************************************************************************
Key Economic Reports:
Thu - Feb 07 - 08:00 – Greek Debt Negotiations Continue
Thu - Feb 09 - 08:30 - Jobless Claims
Thu - Feb 09 - 08:00 – European Central Bank Policy Statement
Fri - Feb 10 - 09:55 - Michigan Sentiment
Charts of Interest: Tuesday and Thursday in separate post.
This commentary and charts-of-interest are designed to stimulate thinking. This analysis is not a recommendation to buy, sell, hold or sell short any security (stock ETF or otherwise). We all need to think for ourselves when it comes to trading our own accounts. First, it is the only way to really learn. Second, we are the only ones responsible for our decisions. Think of these charts as food for further analysis. Before making a trade, it is important to have a plan. Plan the trade and trade the plan. Among other things, this includes setting a trigger level, a target area and a stop-loss level. It is also important to plan for three possible price movements: advance, decline or sideways. Have a plan for all three scenarios BEFORE making the trade. Consider possible holding times. And finally, look at overall market conditions and sector/industry performance.


