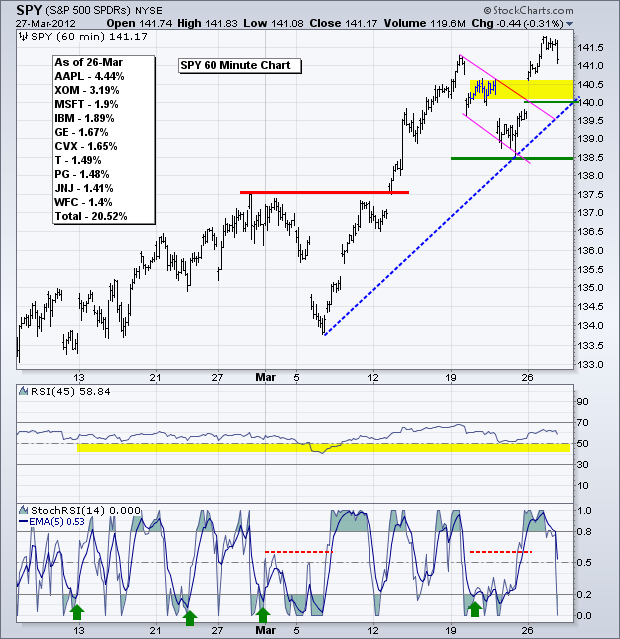
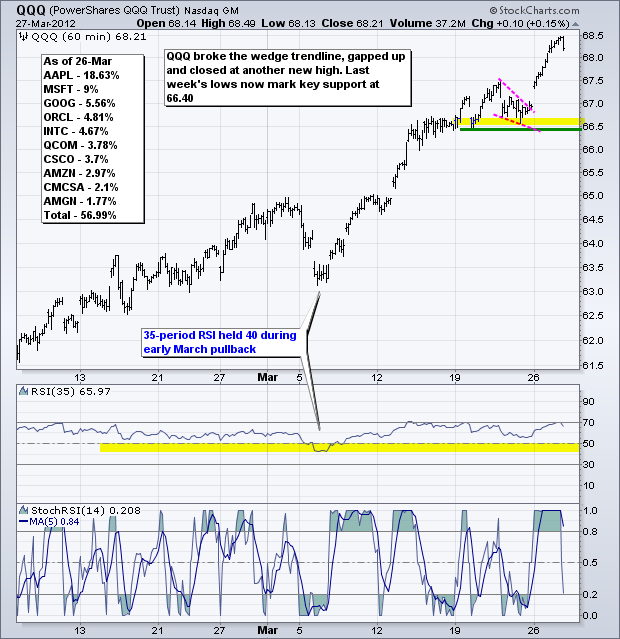
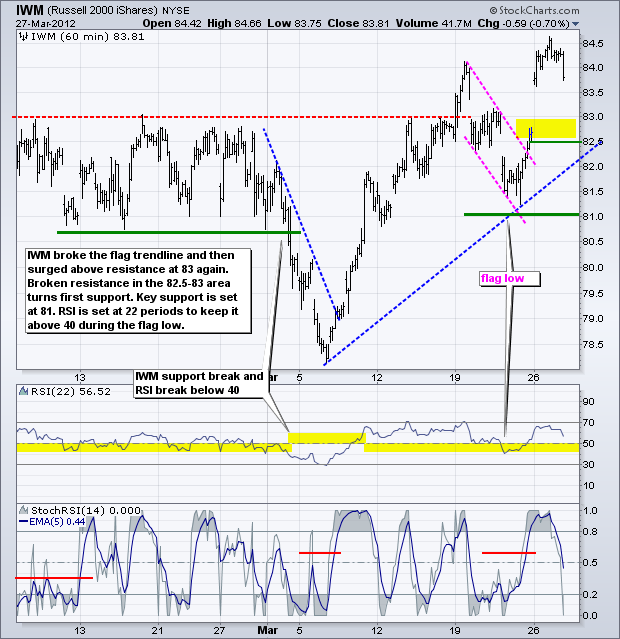
Chinese stocks got slammed on Wednesday and pervasive weakness could weigh on US stocks. The major index ETFs remain in uptrends, but are overbought after big moves on Monday and still quite vulnerable to both a short-term and medium-term correction. On the S&P 500 ETF (SPY) chart, the ETF broke flag resistance with a gap and big move above 141.50, but fell sharply in the final hour of trading on Tuesday. Broken resistance turns first support in the 140-140.50 area. Key resistance is set at 138.50, which is last week's lows. I am going to leave the RSI setting at 45 periods to capture the short-term trend. There are seven 60-minute bars per day, which means a 45-period RSI covers 6.42 days of trading and keeps it as a relatively short-term indicator. The ideal is to filter out small corrections and keep RSI above 40 during an uptrend. 45-period RSI on the 60-minute chart held 40 in early March and last week, which marked the last two short-term corrections.
**************************************************************************
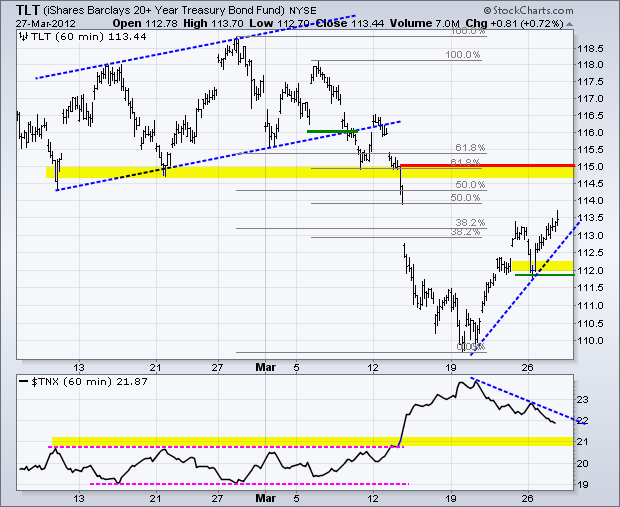
Treasuries remain fairly resilient with a four day advance, but this move still looks like an oversold bounce within a bigger downtrend. Monday's low marks upswing support and a move below this level would reverse the current upswing. Should this upswing continue, broken support and the Fibonacci cluster mark the next resistance level in the 114.5-115 area. Watch stocks for clues. Continued strength in stocks would weigh on treasuries, but weakness in stocks would likely strengthen treasuries.
**************************************************************************
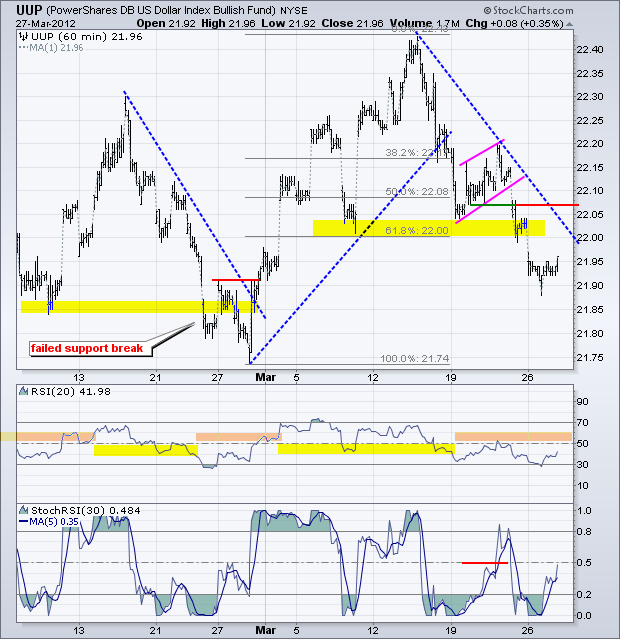
The US Dollar Fund (UUP) remains in a two week downtrend that exceeded the 61.80% retracement line. While the ETF remains above the late February low, we have yet to see a reversal that would actually forge a higher low. Keep in mind that the ETF forged a higher high in mid March. I am setting key resistance at 22.08 for now. A move above this level would break the mid March trendline and negate the flag break. Also look for RSI to break above 60 to confirm.
**************************************************************************
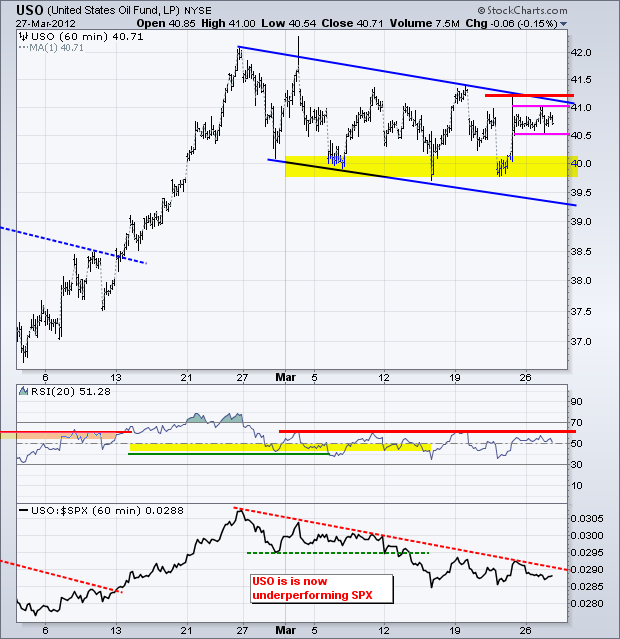
Stocks have been rising and the Dollar falling the last two weeks, but oil cannot sustain a bid and forge a breakout. The US Oil Fund (USO) remains in a downtrend since late February and this decline looks like a falling flag on the daily chart. After a surge late last week, the ETF consolidated within this falling channel and formed a small flat flag. A break above 41 would be the first sign of strength and a move above key resistance would complete the breakout. Look for RSI to exceed 65 for confirmation.
**************************************************************************
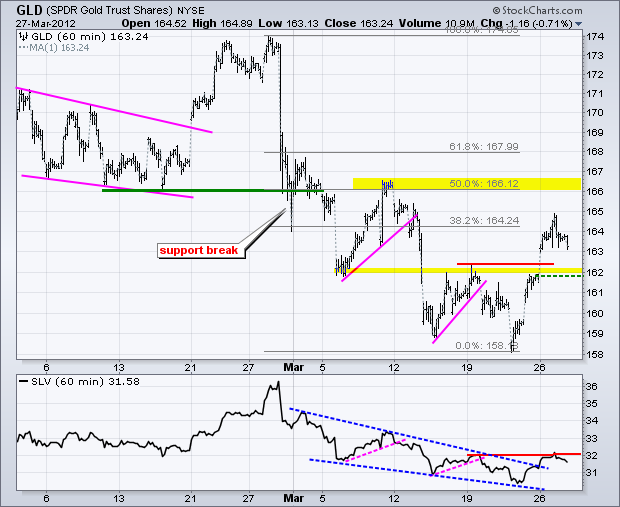
No change. The Gold SPDR (GLD) broke the string of lower lows and lower highs with a surge above 163 on Monday. This breakout reverses the downtrend and broken resistance turns first support around 162. A strong breakout should hold and a move back below the breakout would question bullish resolve. Also note that the Silver Trust (SLV) has yet to breakout at 32.
**************************************************************************
Key Economic Reports:
Wed - Mar 28 - 07:00 - MBA Mortgage Index
Wed - Mar 28 - 08:30 - Durable Orders
Wed - Mar 28 - 10:30 - Oil Inventories
Thu - Mar 29 - 08:30 - Jobless Claims
Thu - Mar 29 - 08:30 - GDP
Fri - Mar 30 - 08:30 - Personal Income & Spending
Fri - Mar 30 - 09:45 - Chicago PMI
Fri - Mar 30 - 09:55 - Michigan Sentiment
Charts of Interest: Tuesday and Thursday in separate post.
This commentary and charts-of-interest are designed to stimulate thinking. This analysis is not a recommendation to buy, sell, hold or sell short any security (stock ETF or otherwise). We all need to think for ourselves when it comes to trading our own accounts. First, it is the only way to really learn. Second, we are the only ones responsible for our decisions. Think of these charts as food for further analysis. Before making a trade, it is important to have a plan. Plan the trade and trade the plan. Among other things, this includes setting a trigger level, a target area and a stop-loss level. It is also important to plan for three possible price movements: advance, decline or sideways. Have a plan for all three scenarios BEFORE making the trade. Consider possible holding times. And finally, look at overall market conditions and sector/industry performance.

