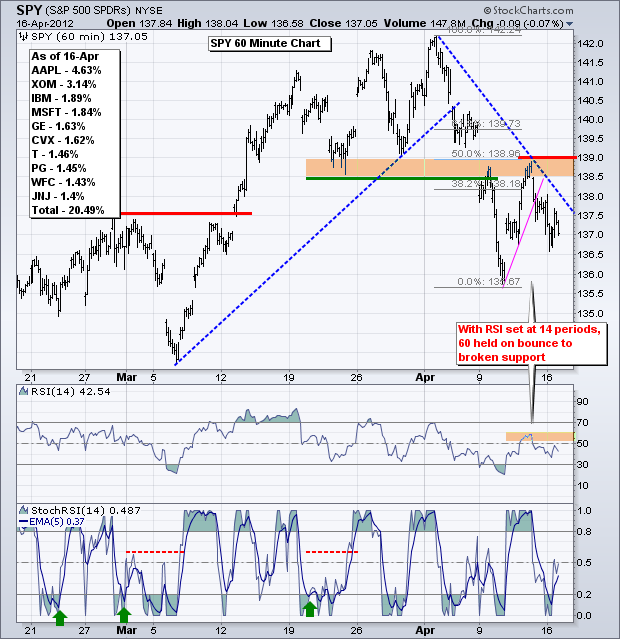
The short-term trends for the major index ETFs may be down, but the medium-term and long-term trends are still up. Keep this in mind before getting too bearish. My best guess is that stocks will enter some sort of trading range over the next few weeks to digest the big gains seen since early October. SPY remains in a downtrend after the failure at broken support and the break below 138 on Friday. I redrew the trendline extending down from the early April high and it now marks first resistance at 138.2. Key resistance remains in the 138.5-139 area, which is marked by broken support and last week's high. I set RSI at 14 because this timeframe corresponds with a failure at 60 on the oversold bounce. A break above 60 would turn momentum bullish. It may be a little early to curve-fit RSI so be careful for false signals that are not confirmed on the price chart. Keep in mind that RSI signals are based on the 60-minute close, not the 60-minute highs and lows. Those looking for faster signals can use the highs and lows, but this will also increase the chances of whipsaw.
**************************************************************************
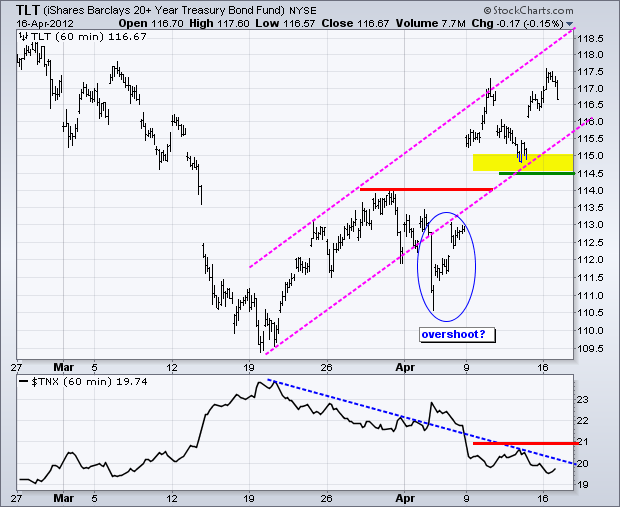
Treasuries are likely to move counter to the stock market and Dollar. Strength in both would be bearish for Treasuries, while weakness in both would be bullish. On the price chart, the 20+ Year T-Bond ETF (TLT) is rising within a steep rising channel. I drew through the early April spike low because it looks like an overshoot. Key support is set in the 114.5-115 area. A move below this level would reverse the short-term uptrend.
**************************************************************************
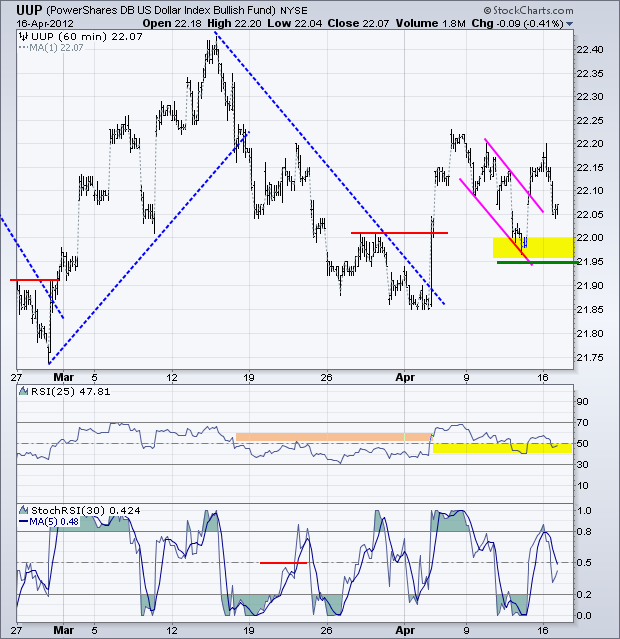
The US Dollar Fund (UUP) fell back after its flag breakout, but remains above support in the 21.95-22 area. For now the flag breakout is holding and key support remains at 21.95. RSI support is set at 40.
**************************************************************************
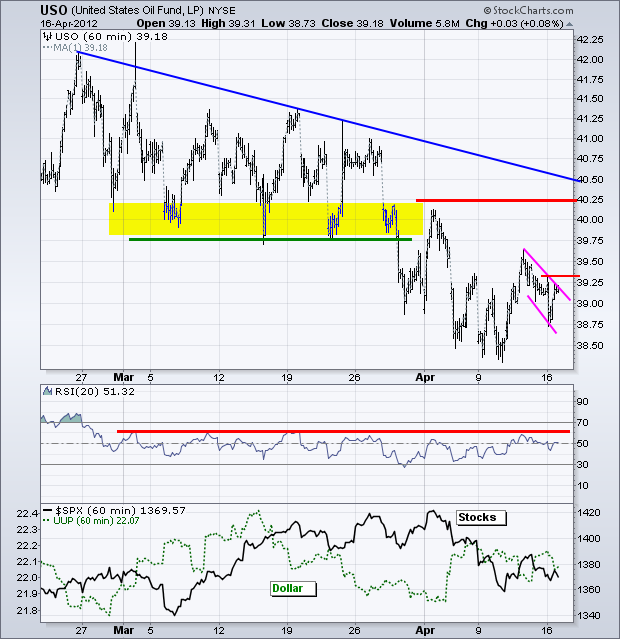
The US Oil Fund (USO) remains in a downtrend, but appears to be finding support in the 38.5-39 area. The ETF surged last week and then formed a falling flag the last few days. A break above 39.35 would be the first bullish sign. RSI remains stuck below 65 and a break above this level is needed to turn momentum bullish. Note that oil and gold have been positively correlated since late February. Oil peaked on 24 February and gold peaked on 28 February. Both have been moving lower the last 6-7 weeks.
**************************************************************************
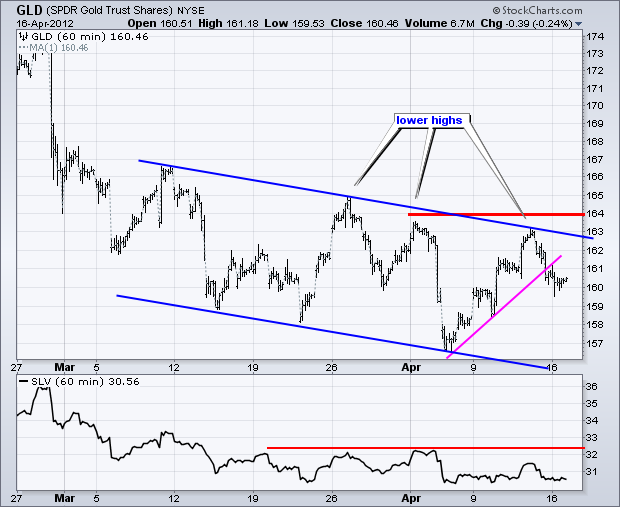
No change. The Gold SPDR (GLD) had some good pops the last few weeks, but each pop ultimately formed a lower high and the downtrend continued. GLD broke down in late February with a sharp decline and has since been zigzagging lower. The bounce back to 163 last week marks the latest upswing, which was broken with the decline below 161 on Friday. The 163-164 zone marks key resistance. A break above this level is needed to reverse the string of lower highs.
**************************************************************************
Key Economic Reports:
Tue - Apr 17 - 08:30 - Housing Starts/Building Permits
Tue - Apr 17 - 09:15 - Industrial Production
Wed - Apr 18 - 07:00 - MBA Mortgage Index
Wed - Apr 18 - 10:30 - Crude Inventories
Thu - Apr 19 - 08:30 - Initial Claims
Thu - Apr 19 - 10:00 - Existing Home Sales
Thu - Apr 19 - 10:00 - Philadelphia Fed
Thu - Apr 19 - 10:00 - Leading Indicators
Charts of Interest: Tuesday and Thursday in separate post.
This commentary and charts-of-interest are designed to stimulate thinking. This analysis is not a recommendation to buy, sell, hold or sell short any security (stock ETF or otherwise). We all need to think for ourselves when it comes to trading our own accounts. First, it is the only way to really learn. Second, we are the only ones responsible for our decisions. Think of these charts as food for further analysis. Before making a trade, it is important to have a plan. Plan the trade and trade the plan. Among other things, this includes setting a trigger level, a target area and a stop-loss level. It is also important to plan for three possible price movements: advance, decline or sideways. Have a plan for all three scenarios BEFORE making the trade. Consider possible holding times. And finally, look at overall market conditions and sector/industry performance.

