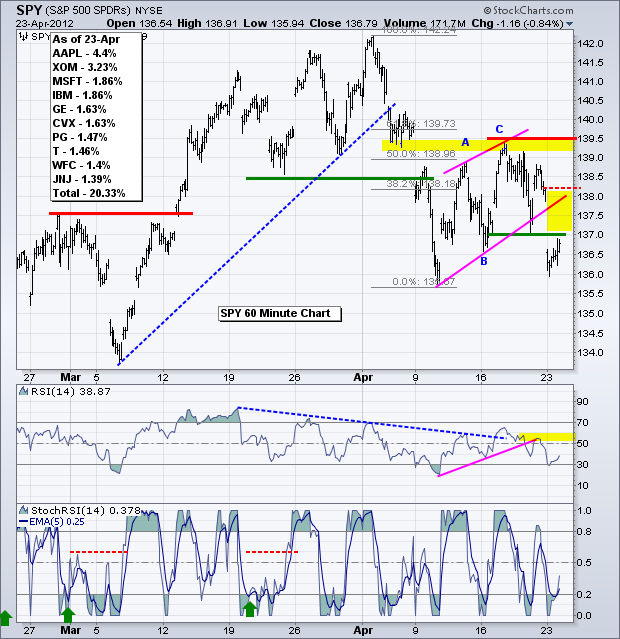
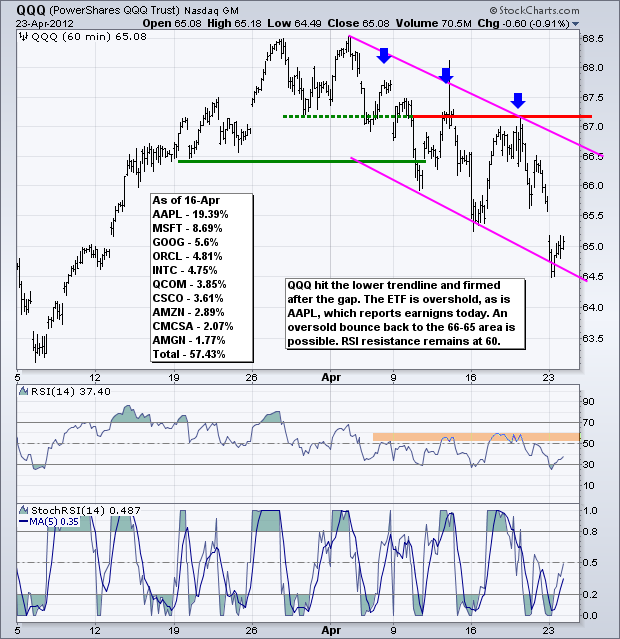
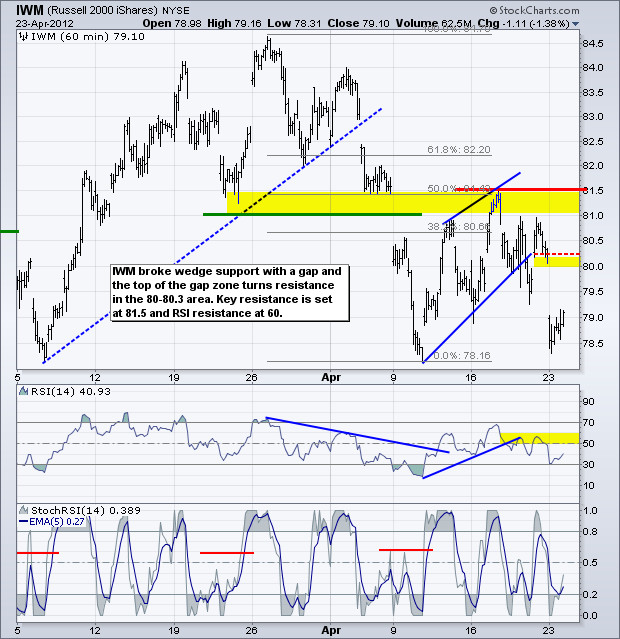
Stocks are short-term oversold, it is turnaround Tuesday, Apple reports earnings today and the bigger trend (6 months) remains up. On top of all this, traders will also be gearing up for the start of the Fed meeting today and policy statement on Wednesday (12:30PM). Stocks moved lower on Monday, but managed to firm after the initial gap and consolidate somewhat. On the SPY chart, the ETF broke wedge support with a gap below 137 on the open. SPY closed below 137 and the gap zone around 137-138 marks the first resistance zone. A quick move back above 138.15 would challenge the validity of this wedge break. I added 15 cents as a buffer. It would take a break above key resistance at 139.5 to fully reverse the current downtrend. RSI moved below 30 as downside momentum accelerated on Monday. Momentum resistance is set in the 50-60 zone.
**************************************************************************
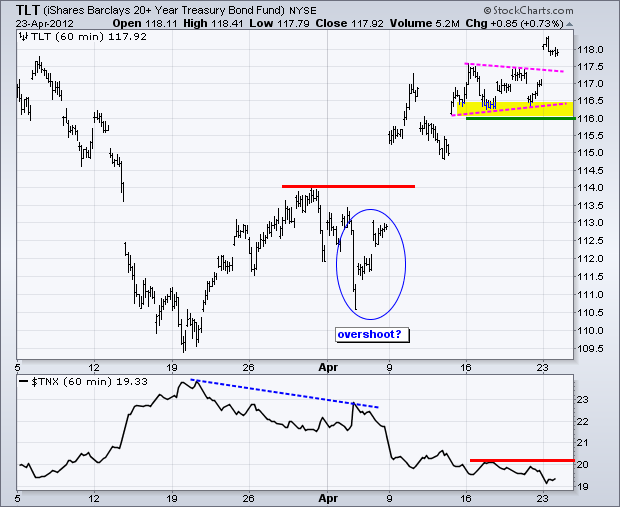
The treasury market will likely hang on every Fed nuance on Wednesday so get prepared for some action. The 20+ Year T-Bond ETF (TLT) remains in a rather strong uptrend after a move from 109.5 to 118. Treasuries seem to be anticipating QE3 or further dovish talk from the Fed. TLT most recently broke pennant resistance at 117.5 and this zone turns first support. Last week's lows become key support at 116.
**************************************************************************
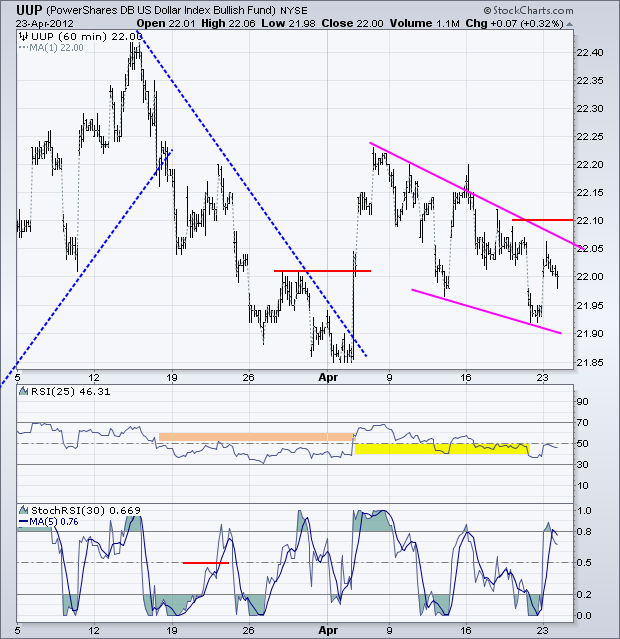
The US Dollar Fund (UUP) bounced on Monday, but remains within a falling wedge pattern that defines the short-term downtrend. Key resistance is set at 22.10 and a breakout here is needed to reverse the downtrend.
**************************************************************************
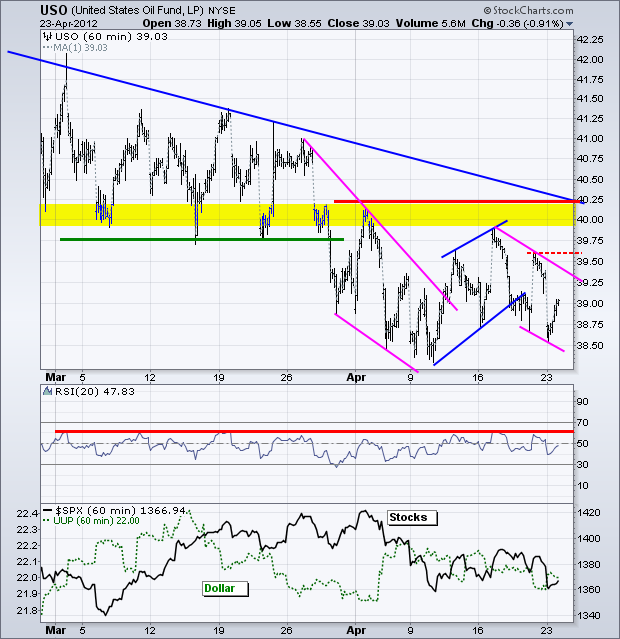
It is a battle of the wedges on the US Oil Fund (USO) chart. The ETF remains in a bigger downtrend after the support break in late March. USO also formed a series of wedges the last four weeks (falling, rising and falling). The most recent wedge or channel is falling with first resistance marked at Friday's high (39.61). A move above this level would reverse the four day downswing and set up another resistance challenge.
**************************************************************************
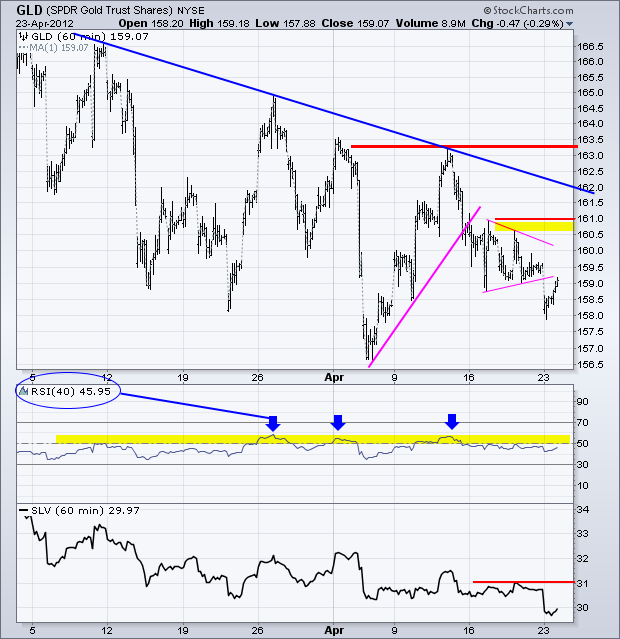
The Gold SPDR (GLD) broke pennant support with a weak open and then rebounded with a move back above 159. There are two downtrends present on this chart. First, GLD has been zigzagging lower since late February. Second, GLD broke upswing support with a decline on April 13th to start a downswing. The pennant highs mark first resistance in the 160.5-161 area. RSI resistance remains at 60. A break above both these levels is needed before thinking bull on bullion.
**************************************************************************
Key Economic Reports:
Tue - Apr 24 - 08:30 – FOMC Meeting Begins
Tue - Apr 24 - 09:00 – Case-Shiller Housing Index
Tue - Apr 24 - 10:00 – Consumer Confidence
Tue - Apr 24 - 10:00 – New Home Sales
Wed - Apr 25 - 08:30 – Durable Goods Orders
Wed - Apr 25 - 10:30 - Oil Inventories
Wed - Apr 25 - 12:30 – FOMC Policy Statement
Thu - Apr 26 - 08:30 - Jobless Claims
Thu - Apr 26 - 10:00 – Pending Home Sales
Fri - Apr 27 - 10:00 - GDP
Fri - Apr 27 - 09:55 – Michigan Sentiment
Charts of Interest: Tuesday and Thursday in separate post.
This commentary and charts-of-interest are designed to stimulate thinking. This analysis is not a recommendation to buy, sell, hold or sell short any security (stock ETF or otherwise). We all need to think for ourselves when it comes to trading our own accounts. First, it is the only way to really learn. Second, we are the only ones responsible for our decisions. Think of these charts as food for further analysis. Before making a trade, it is important to have a plan. Plan the trade and trade the plan. Among other things, this includes setting a trigger level, a target area and a stop-loss level. It is also important to plan for three possible price movements: advance, decline or sideways. Have a plan for all three scenarios BEFORE making the trade. Consider possible holding times. And finally, look at overall market conditions and sector/industry performance.

