The risk-off trade has been dominant since May and shows no signs of changing this week. The world is openly talking about a Greek exit from the Euro, perhaps within a month. The fear is not so much the Greek exit, but rather the affect it will have on Portugal and Spain. We could see borrowing costs surge and perhaps even a run on Spanish banks. Also note that Portugal will likely need another bailout within the next two months. To make matters worse, European voters are continuing to express their angst with austerity. Merkel's party lost in regional elections over the weekend.
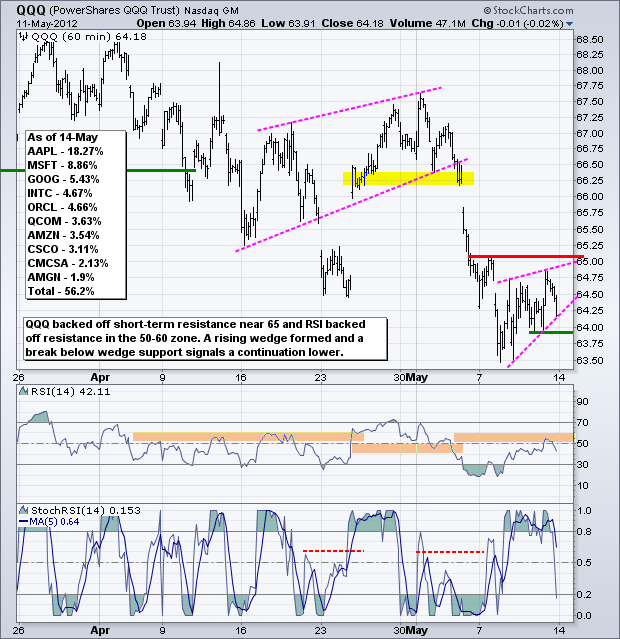
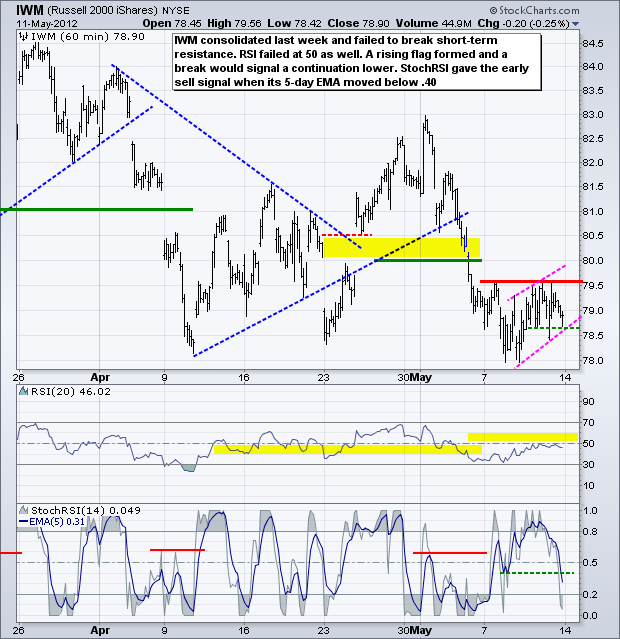
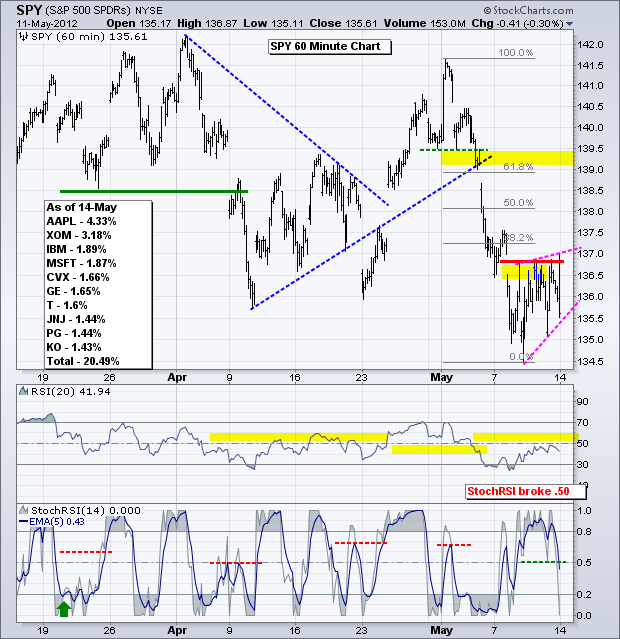
Moving to the US, it is a big economic reporting week. The last big round of reports (30-Apr to 4-May) produced a series of worse-than-expected numbers. Even though the numbers were not bad, lower than expected growth rates triggered a re-pricing in US equities. Tuesday is the big day with Retail Sales and the Empire State Manufacturing Index scheduled. Disappointments in these two reports could lead to key support breaks in several of the major index ETFs. Note that the Dow Industrials SPDR (DIA), Russell 2000 ETF (IWM) and S&P MidCap 400 SPDR (MDY) are consolidating near their March-April lows. The Nasdaq 100 ETF (QQQ) and S&P 500 ETF (SPY) are currently below their April lows and showing relative weakness since the late March highs.
**************************************************************************
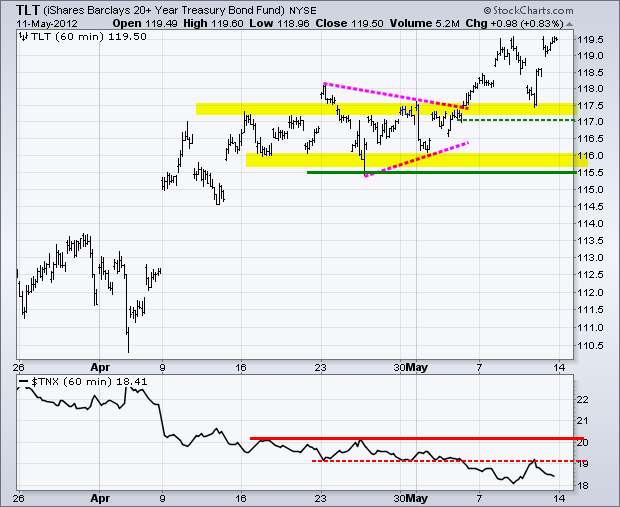
US treasuries remain at the forefront of the risk-off trade. The 20+ Year T-Bond ETF (TLT) broke triangle resistance in early May and broken resistance turned into support in the 117-117.5 area. TLT closed near its high for the week and this is negative for stocks. Treasuries and stocks are riding the risk-off seesaw. Treasuries rise when stocks decline and visa versa. The 7-10 year T-Bond ETF (IEF) closed at a 52-week (closing) high last week and the 10-year Treasury Yield ($TNX) is below 2%.
**************************************************************************
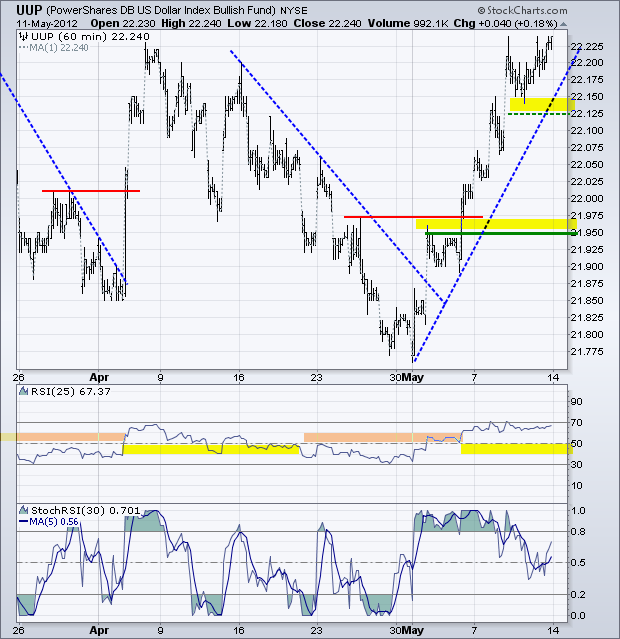
The Dollar is benefitting from the move into treasuries because foreign entities must buy Dollars before buying treasuries. Also note that currencies trade in pairs, which means weakness in one currency (Euro) equates to strength in the other (Dollar). The focus remains on the Euro this week and I do not expect good news. Eurozone finance ministers are meeting to hammer out some solutions, but three of the ministers are basically lame-duck ministers because of recent elections (France, Greece) or fallen governments (The Netherlands). In other words, the French finance minister is from the Sarkozy government, not from the Hollande government. On the price chart, the US Dollar Fund (UUP) is challenging the April high and a break above this level has medium-term implications. First support is set at 22.125 and key support at 21.95 for now.
**************************************************************************
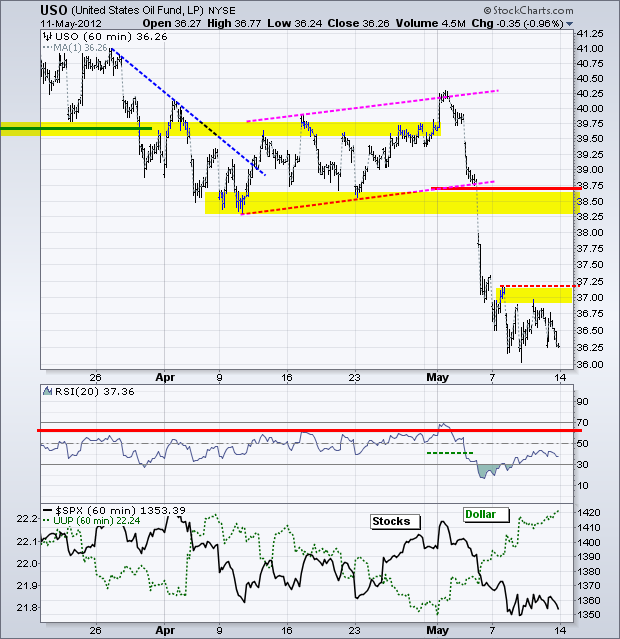
No change. Oil fell off a cliff the last two weeks and remains quite oversold. Nevertheless, weakness in global equities, strength in the Dollar and a rise in oil inventories continue to weigh. Demand and supply issues are hitting crude at the same time. Last week the Energy department reported that US stockpiles hit their highest level since 1990 and average demand for fuel is edging lower. On the price chart, the US Oil Fund (USO) is oversold and the December low marks possible support around 36, but there are no signs of strength. Broken supports in the 38.5-38.75 area turn into key resistance.
**************************************************************************
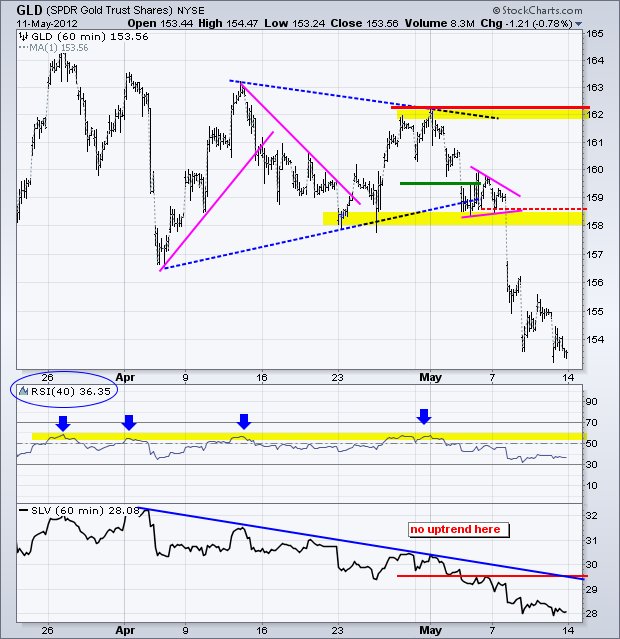
No change. The two week advance in the Dollar clearly weighed on gold, which fell around 5% the last two weeks. Continued strength in the Dollar and weakness in stocks would be negative for bullion, even though it is oversold. Broken supports in the 158-158.5 area turn into first resistance. 20-period RSI resistance remains in the 50-60 zone. The Silver Trust (SLV) is underperforming GLD and this suggests relative weakness in industrial metals, which is also negative for the economic outlook.
**************************************************************************
Key Economic Reports:
Tue - May 15 - 08:30 - Retail Sales
Tue - May 15 - 08:30 – Consumer Price Index (CPI)
Tue - May 15 - 08:30 - Empire State Manufacturing Index
Tue - May 15 - 10:00 - Business Inventories
Tue - May 15 - 10:00 - NAHB Housing Market Index
Wed - May 16 - 07:00 - MBA Mortgage
Wed - May 16 - 08:30 - Housing Starts/Building Permits
Wed - May 16 - 09:15 - Industrial Production
Wed - May 16 - 10:30 - Oil Inventories
Wed - May 16 - 14:00 - FOMC Minutes
Thu - May 17 - 08:30 – Jobless Claims
Thu - May 17 - 10:00 - Philadelphia Fed
Thu - May 17 - 10:00 - Leading Indicators
Fri - May 18 - 10:00 - TGIF
Charts of Interest: Tuesday and Thursday in separate post.
This commentary and charts-of-interest are designed to stimulate thinking. This analysis is not a recommendation to buy, sell, hold or sell short any security (stock ETF or otherwise). We all need to think for ourselves when it comes to trading our own accounts. First, it is the only way to really learn. Second, we are the only ones responsible for our decisions. Think of these charts as food for further analysis. Before making a trade, it is important to have a plan. Plan the trade and trade the plan. Among other things, this includes setting a trigger level, a target area and a stop-loss level. It is also important to plan for three possible price movements: advance, decline or sideways. Have a plan for all three scenarios BEFORE making the trade. Consider possible holding times. And finally, look at overall market conditions and sector/industry performance.

