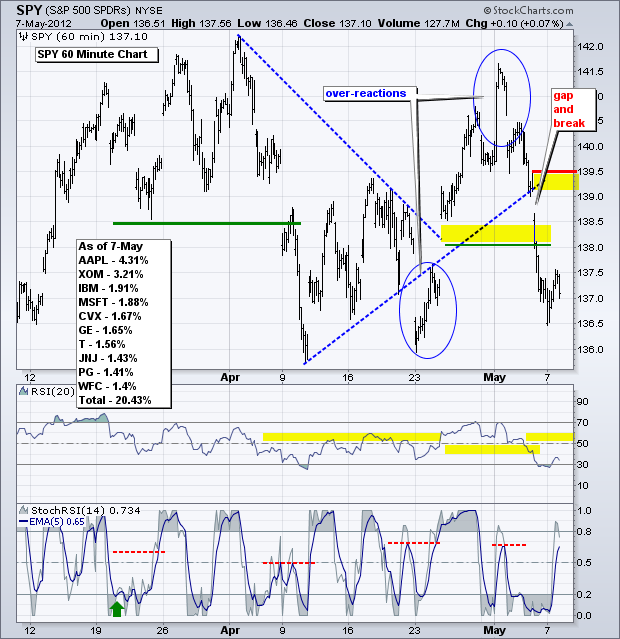
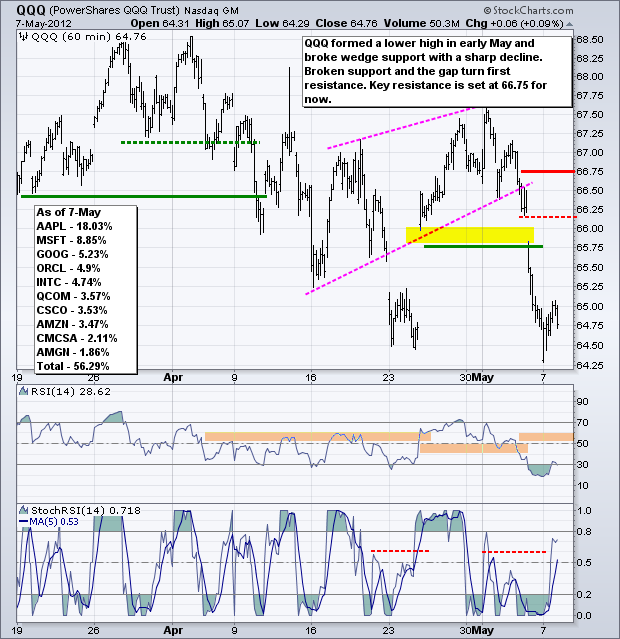
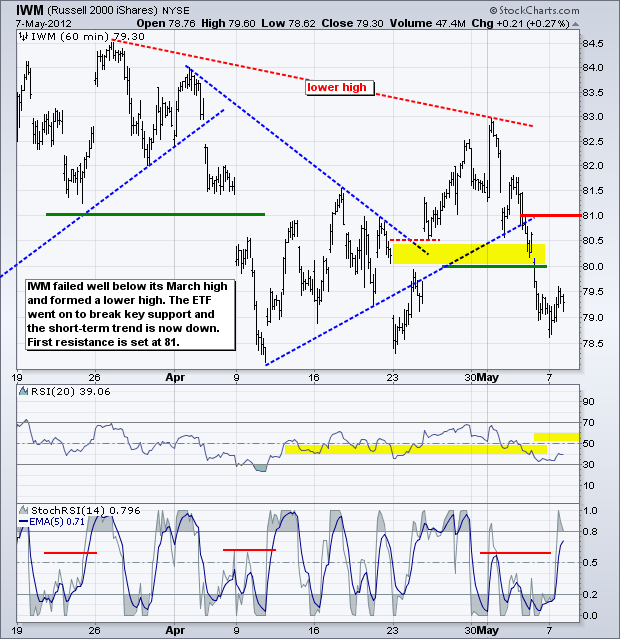
After a big decline last week, stocks firmed on Monday and there is no change for the major index ETFs. A lot of news hit the fan over the past week and it looks like traders took a rest on Monday. The results of the Greek and French elections did not spook stocks on Monday because the results were already priced into the market. Keep in mind that these results were hardly surprising. While some firmness may seem positive, stocks were way oversold and ripe for some sort of bounce or consolidation by Friday's close. At this point, last week's break downs are bearish and remain the dominant chart features. On the SPY chart, broken support and the gap mark a large resistance zone (138-139.5). Upper resistance is set at 139.5, which is considered key resistance and it would take a move above this level to complete reverse last week's break down. RSI resistance is set in the 50-60 zone for now.
**************************************************************************
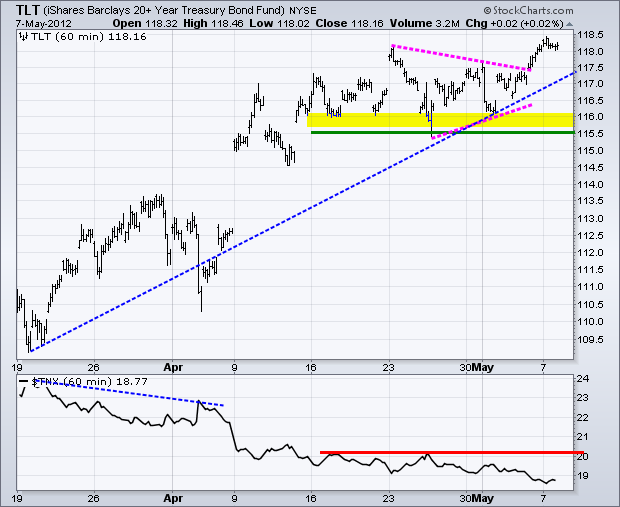
No change. The 20+ Year T-Bond ETF (TLT) also made a big statement on Friday with a triangle breakout to signal a continuation of the uptrend. A breakout in treasuries is negative for stocks and favors the risk-off trade. Key support remains in the 115.5-116 area.
**************************************************************************
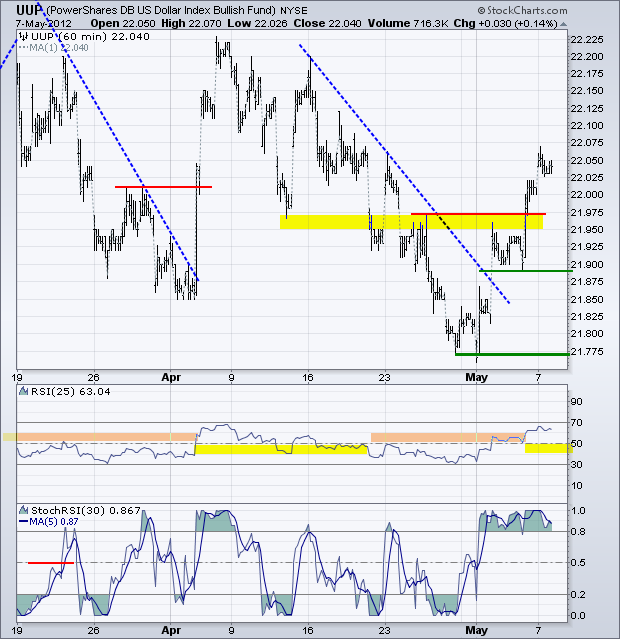
No change. The US Dollar Fund (UUP) broke trendline resistance mid week and then broke above key resistance with a surge on Friday. The mid week consolidation marks the first support zone in the 21.90-21.975 area. RSI support is set at 40. I think the long-term trend for UUP is up (since August) and last week's short-term reversal is setting up for a continuation of the prior surge (from late August to early January). This could propel UUP to the 23 area. While not a big move in percentage terms, it could affect gold and other commodities.
**************************************************************************
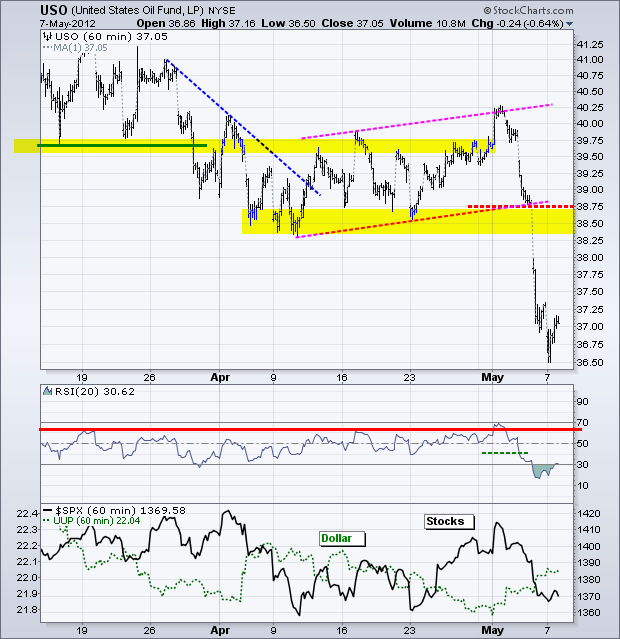
No change. The US Oil Fund (USO) broke support in the 39.75 area, consolidated with a rising wedge and then broke down on Thursday. The ETF continued sharply lower on Friday and is now quite oversold. Nevertheless, weakness in global equities and strength in the Dollar will continue to weigh on oil. The December low marks the next support level around 36. Broken supports in the 38.5-38.75 area turn into first resistance.
**************************************************************************
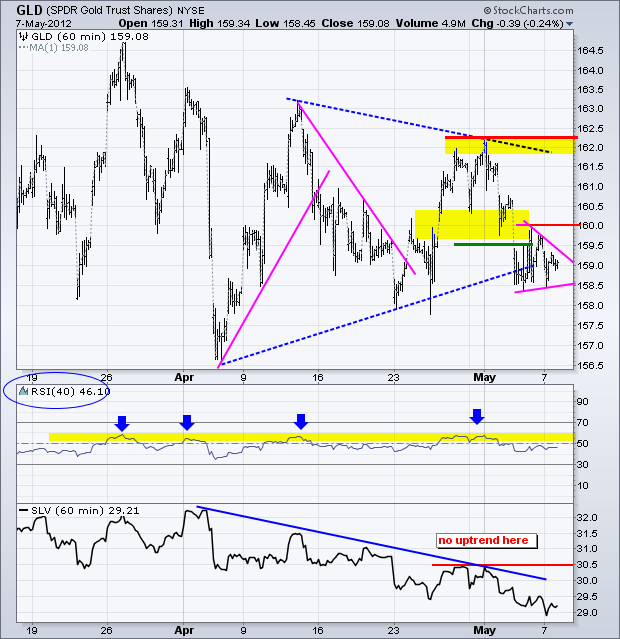
The Gold SPDR (GLD) broke down last week and then consolidated around 159 the last 2-3 days. A small triangle (pennant) formed and a break below Monday's low would signal another continuation lower. Swingers can watch resistance at 160 for the first signs of an upside breakout. Two negatives are currently weighing on bullion. First, stocks reversed their short-term uptrends with a sharp decline on Friday. Second, the Dollar reversed its short-term downtrend with a sharp advance the last few days.
**************************************************************************
Key Economic Reports:
Wed - May 09 07:00 - MBA Mortgage Index
Wed - May 09 10:30 - Oil Inventories
Thu - May 10 08:30 - Jobless Claims
Fri - May 11 08:30 – Producer Price Index (PPI)
Fri - May 11 09:55 - Michigan Sentiment
Charts of Interest: Tuesday and Thursday in separate post.
This commentary and charts-of-interest are designed to stimulate thinking. This analysis is not a recommendation to buy, sell, hold or sell short any security (stock ETF or otherwise). We all need to think for ourselves when it comes to trading our own accounts. First, it is the only way to really learn. Second, we are the only ones responsible for our decisions. Think of these charts as food for further analysis. Before making a trade, it is important to have a plan. Plan the trade and trade the plan. Among other things, this includes setting a trigger level, a target area and a stop-loss level. It is also important to plan for three possible price movements: advance, decline or sideways. Have a plan for all three scenarios BEFORE making the trade. Consider possible holding times. And finally, look at overall market conditions and sector/industry performance.

