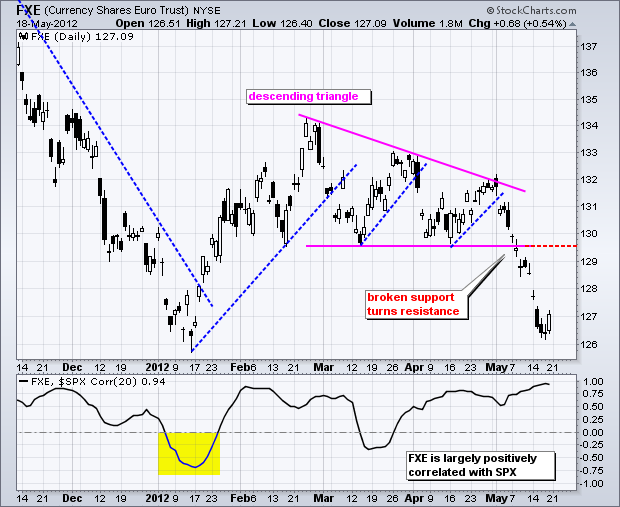
Let the jawboning begin! The G8 came out with a very bold (not) statement over the weekend. In short, they urged Greece to stay in the Euro and said growth issues should be considered. Big deal. There is an EU summit scheduled for Wednesday and we can expect more grandiose announcements without substance. In short, Germany holds all the cards (money) in this game. In fact, it is a question of who blinks first: the Greeks or the Germans. Will Germany let Greece default and exit the Euro if Greece thumbs its nose at austerity again? Or, will Germany blink and authorize more money for Greece regardless of the election outcome?
The Euro Currency Trust (FXE) is as oversold as the stock market. The chart below shows FXE bouncing off the January low on Friday. This is viewed as an oversold bounce within a bigger downtrend. Broken support in the 129.5 area turns into resistance. A bounce in the Euro would be positive for stocks because the Euro and S&P 500 are positively correlated, in a rather strong way. A bounce in the Euro could also extend the rally in gold.
How oversold can stocks get? Numerous indicators suggest that the stock market is oversold and ripe for a bounce. Take the S&P 500 for example. The index is down around 8.8% from its high and just above the 200-day moving average, which is currently at 1278. The Fibonacci Retracements Tool shows a cluster of potential support in the 1295 area. This area marks a 50% retracement of the November-April advance and a 38.2% retracement of the October-April advance.
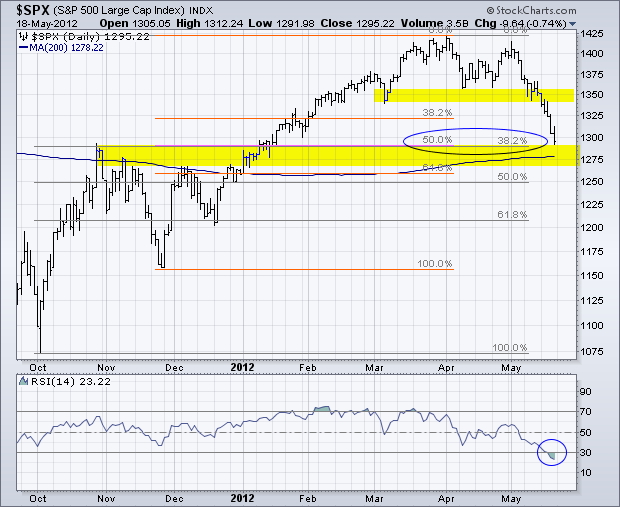
Despite this confluence of bounce indicators, we have yet to see a true selling climax or washout. While one is not guaranteed, especially if everyone is waiting for it, such a climax would provide a better bottom signal. There will be a bounce at some point, but buying at this point is still akin to catching a falling knife. As far as first resistance, broken support turns into first resistance in the 1350 area.
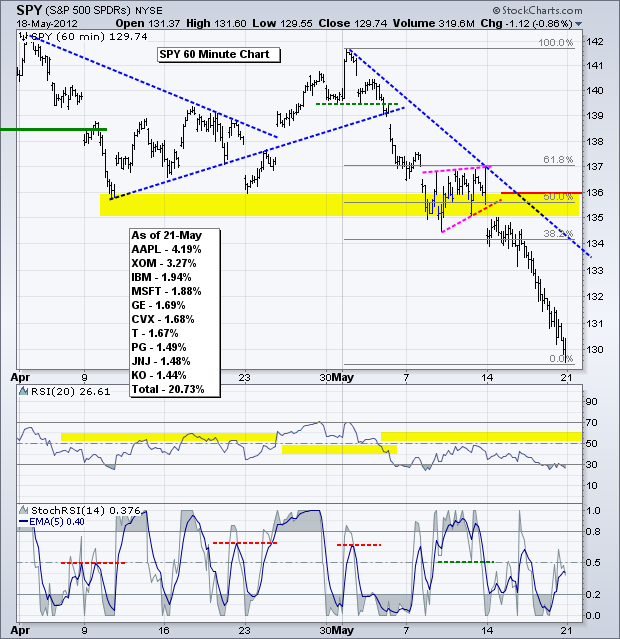
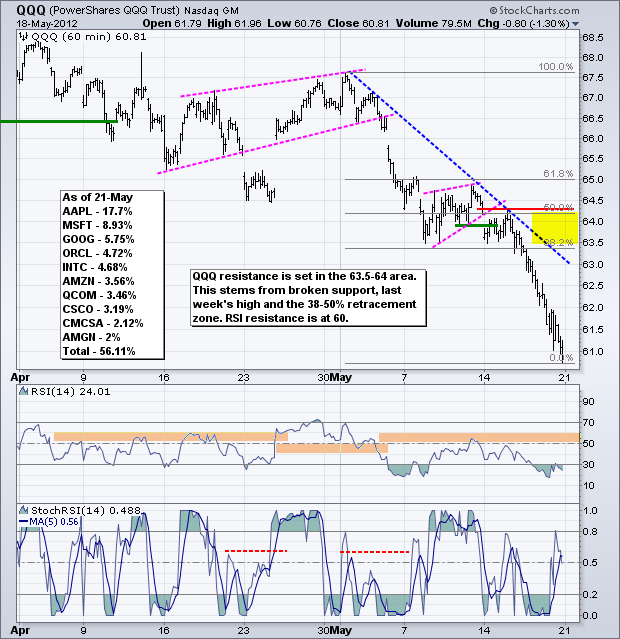
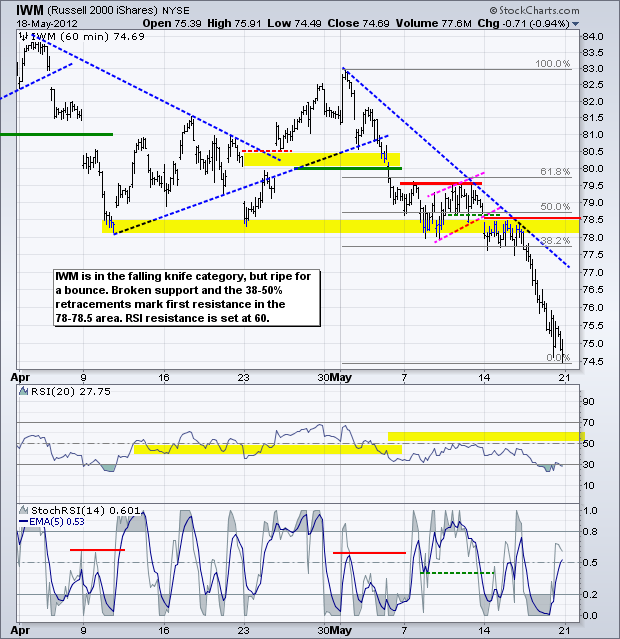
The S&P 500 ETF (SPY) remains in a free fall on the 60-minute chart, but stock futures are pointing for a bounce on the open. Keep in mind that there is often a retest or pullback on the first bounce from oversold levels. As far as potential resistance, the 50% retracement and broken support mark a resistance zone in the 135-136 area. RSI resistance is set in the 50-60 zone.
**************************************************************************
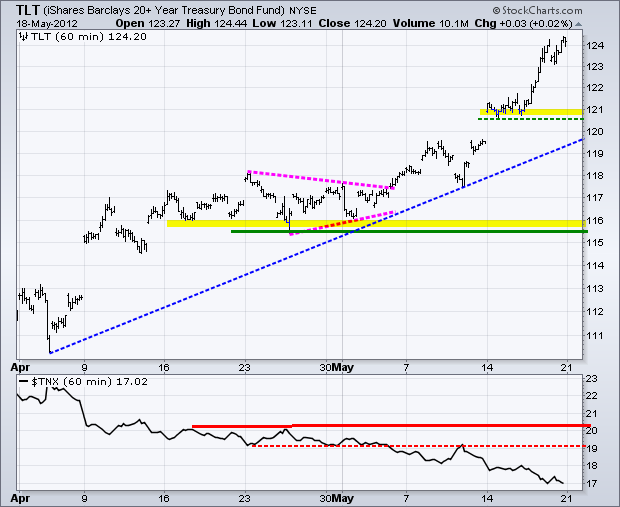
Treasuries are as overbought as stocks are oversold. Even though the Euro bounced on Friday, the 20+ Year T-Bond ETF (TLT) moved higher and closed near a 52-week high. Last week's lows mark the first support zone in the 120.5-121 area. I will keep key support at 115.50 for now and raise it after the first pullback, if we get one.
**************************************************************************
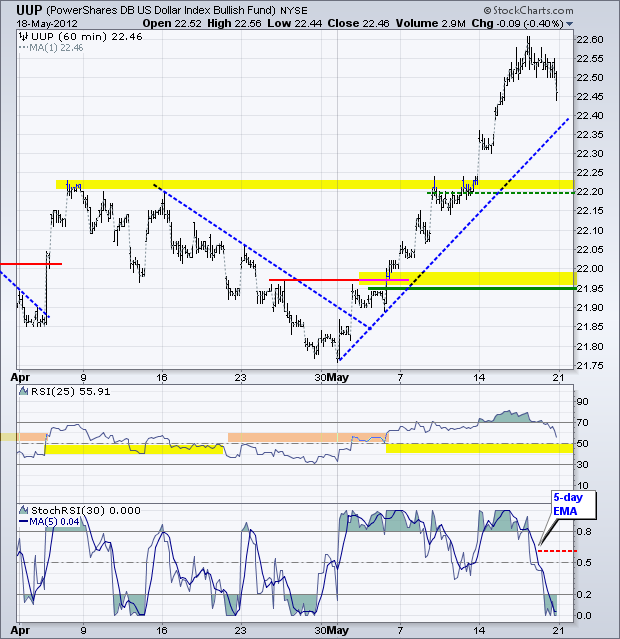
The negative news flow from Europe could ease this week and the Euro could bounce in anticipation of the EU summit. While I am not expecting anything earth shattering, EU leaders will do everything they can to put a positive twist on this summit. The US Dollar Fund (UUP) pulled back from overbought levels on Friday. Nevertheless, the trend is still strong and still up. Broken resistance turns first support in the 22.20 area. Notice how the 5-day EMA for StochRSI moved below .20 to become oversold (dark blue line). A move above .60 would suggest a short-term reversal higher.
**************************************************************************
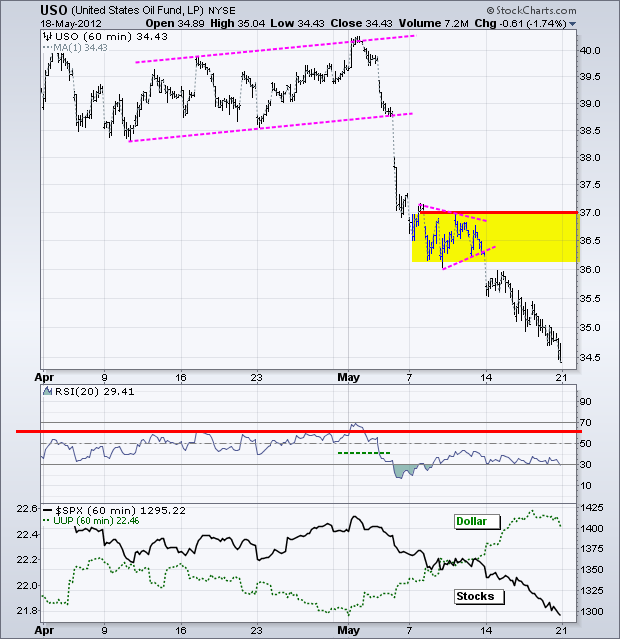
Oil will likely take its cue from stocks and the Euro. A bounce in both would be positive, while declines in both would be negative. The US Oil Fund (USO) is as oversold as the stock market and ripe for a bounce. The pennant formation marks the next resistance level in the 36.50 area. RSI resistance is in the 50-60 zone.
**************************************************************************
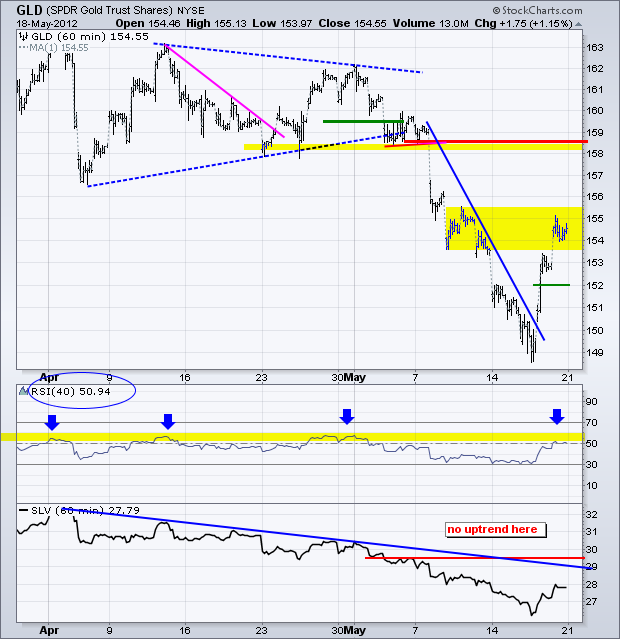
Is this rally for real? We are about to find out. Gold jumped the gun by surging on Thursday and continuing higher on Friday. Stocks and the Euro were both down on Thursday. The Euro bounced on Friday, but stocks finished weak. With this two day surge, the Gold SPDR (GLD) is in its first resistance zone and RSI is in the 50-60 resistance zone. Since late March, GLD has peaked and turned lower when RSI reached this zone. A breakout would be positive and I would then look for a pullback to set up a better risk-reward ratio. The bigger trend remains down, the bottom picking play is over and GLD is currently in no-man's land.
**************************************************************************
Key Economic Reports:
Tue - May 22 - 10:00 - Existing Home Sales
Wed - May 23 - 07:00 - MBA Mortgage Index
Wed - May 23 - 10:00 - New Home Sales
Wed - May 23 - 10:00 - FHFA Housing Price Index
Wed - May 23 - 10:00 – EU Summit
Wed - May 23 - 10:30 - Oil Inventories
Thu - May 24 - 08:30 - Jobless Claims
Thu - May 24 - 08:30 - Durable Orders
Fri - May 25 - 09:55 - Michigan Sentiment
Sun - Jun 17 - 10:00 – Greek Elections
Charts of Interest: Tuesday and Thursday in separate post.
This commentary and charts-of-interest are designed to stimulate thinking. This analysis is not a recommendation to buy, sell, hold or sell short any security (stock ETF or otherwise). We all need to think for ourselves when it comes to trading our own accounts. First, it is the only way to really learn. Second, we are the only ones responsible for our decisions. Think of these charts as food for further analysis. Before making a trade, it is important to have a plan. Plan the trade and trade the plan. Among other things, this includes setting a trigger level, a target area and a stop-loss level. It is also important to plan for three possible price movements: advance, decline or sideways. Have a plan for all three scenarios BEFORE making the trade. Consider possible holding times. And finally, look at overall market conditions and sector/industry performance.

About the author:
Arthur Hill, CMT, is the Chief Technical Strategist at TrendInvestorPro.com. Focusing predominantly on US equities and ETFs, his systematic approach of identifying trend, finding signals within the trend, and setting key price levels has made him an esteemed market technician. Arthur has written articles for numerous financial publications including Barrons and Stocks & Commodities Magazine. In addition to his Chartered Market Technician (CMT) designation, he holds an MBA from the Cass Business School at City University in London.
Learn More
