Stocks were under pressure on Thursday after a worse-than-expected ISM Services Index. This diffusion index came in at 53.5 for April, compared to 56 in March. Even though the index dropped, it remains well above 50 and indicative of economic expansion, not contraction. From ism.com, "A diffusion index measures the degree to which a change in something is dispersed, spread out, or "diffused" in a particular group". As Art Cashin noted yesterday, this means it is not a "hard" number, as opposed to non-farm payrolls. In any case, the ISM Indexes provide a pretty good idea of economic direction. Anything above 50 favors expansion. Anything below 50 favors contraction. Real trouble starts if/when they move below 50 and they are not close yet. Elsewhere, initial jobless claims fell 27,000, which was the biggest weekly decline since May 2010. However, the four week average rose and is at its highest level since December. Overall, this week's economic data was below expectation. Even though the data were not great, the data were certainly not bad. The economic is still muddling along at a modest clip.
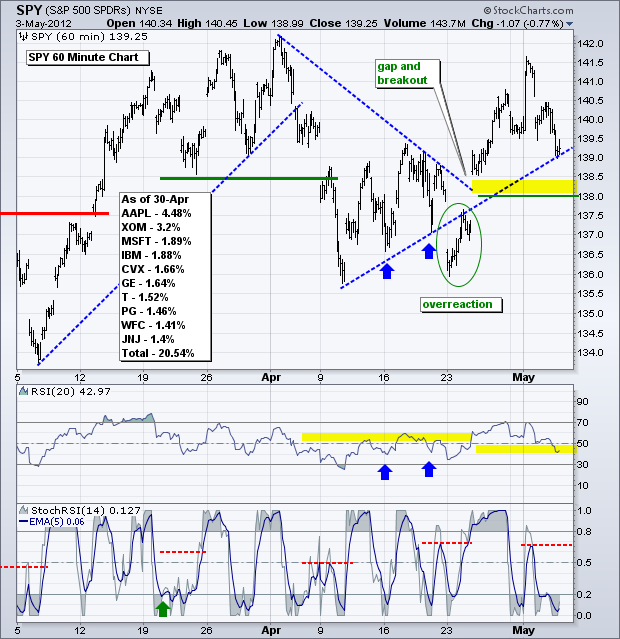
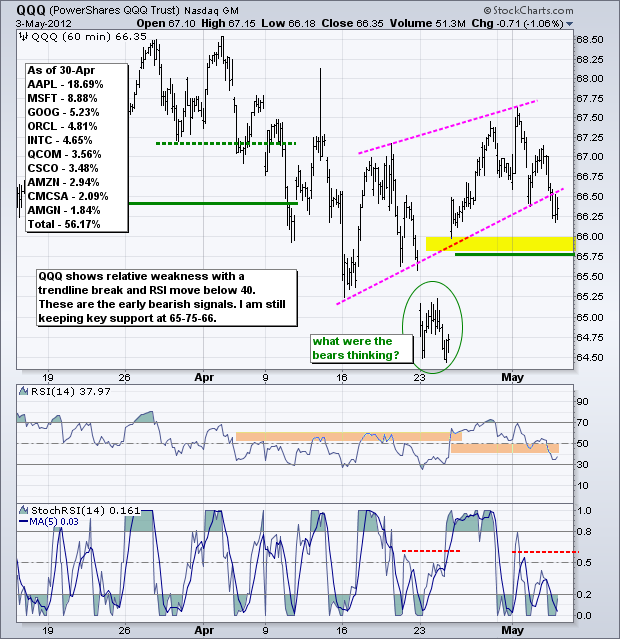
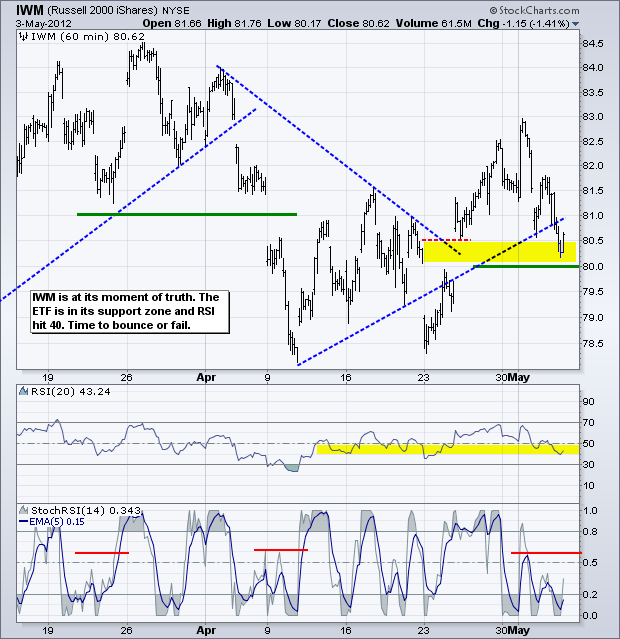
Stock market reaction has also been mixed. Stocks dropped on Monday, popped on Tuesday, dropped on Wednesday and then fell back on Thursday. Overall, it looks like there was more drop than pop. On the price chart, the S&P 500 ETF (SPY) is trading right at the April trendline and RSI is at 40. The 5-day EMA for StochRSI moved below .20 and established resistance at .65. A surge above this level would signal a successful trendline test and keep the short-term uptrend alive. This is the moment-of-truth and the employment report is on deck this morning. A better-than-expected number (>150,000) would be quite positive for the economy and stock market, while a worse-than-expected number (<100,000) would be negative. Stay tuned.....
**************************************************************************
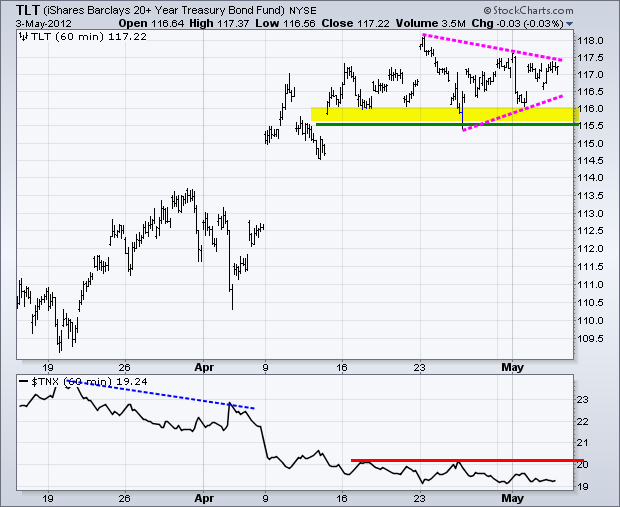
The noose is tightening for the 20+ Year T-Bond ETF (TLT) as the consolidation narrows. We did not get a triangle break Thursday, but will most likely see one on Friday (famous last words). A break above triangle resistance keeps the uptrend alive and signals a continuation higher. This would be bearish for stocks. A support break at 115.50 would be bearish for treasuries and bullish for stocks. A better-than-expected number (>150,000) would be bearish, while a worse-than-expected number (<100,000) would be bullish.
**************************************************************************
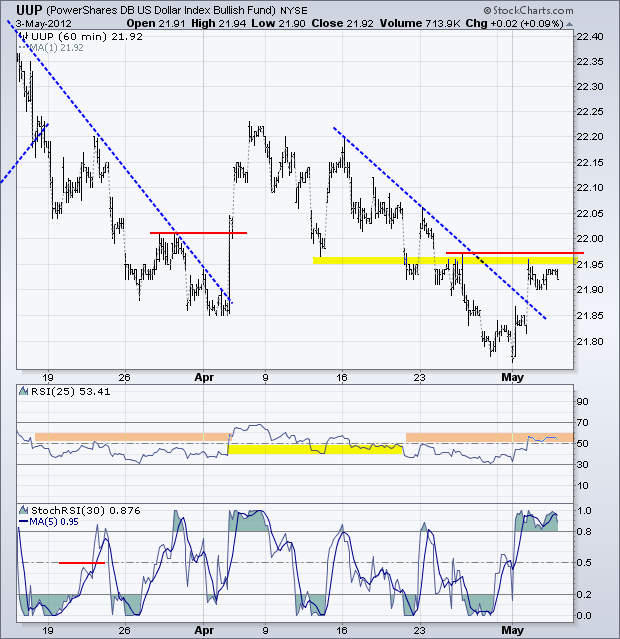
No change. The US Dollar Fund (UUP) made a move on Wednesday with a trendline break and surge above 21.90. After Friday's employment report, the US news cycle will peak and attention may turn to Europe. Note that the European Central Bank (ECB) makes its policy statement today. More emphasis on growth (aka easy money) would be bearish for the Euro. Also note that Greece and France go to the polls on Sunday with the incumbents poised for a setback. On the price chart, a break above key resistance and RSI resistance would be short-term bullish for the greenback.
**************************************************************************
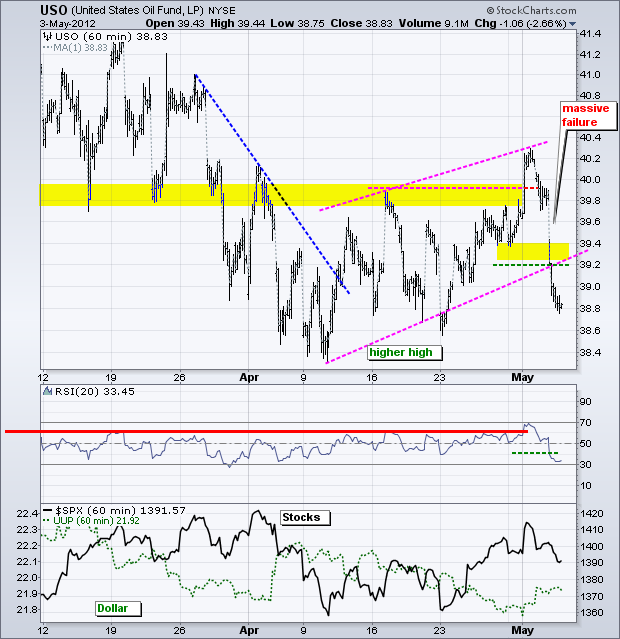
The US Oil Fund (USO) remains one of the toughest short-term trades around. After breaking out above 40, the ETF plunged below 39 and broke the internal trendline extending up from early April. Overall, the April zigzag higher looks like a rising wedge of sorts and this week's breakdown is bearish. RSI broke below 40 to put momentum back in the bearish camp. Perhaps oil is looking ahead to a potential bounce in the Dollar and fall in the stock market.
**************************************************************************
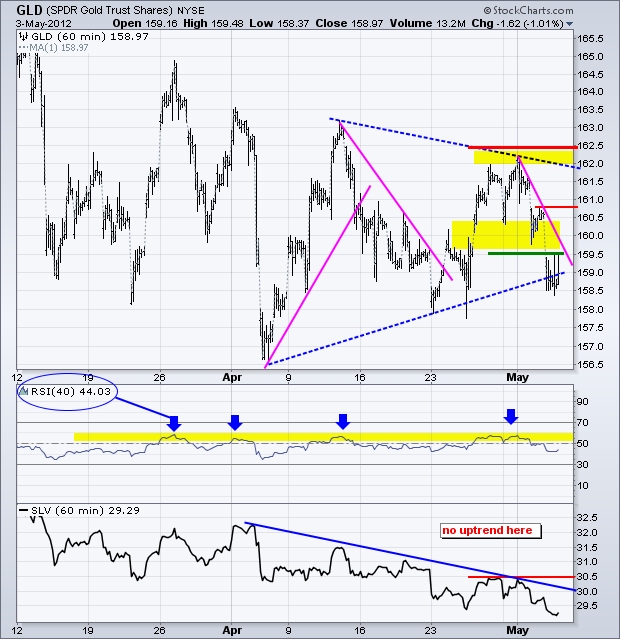
The Gold SPDR (GLD) formed a lower high around 162 and broke upswing support at 159.5 with a sharp decline on Thursday. Perhaps gold is also looking ahead to next week and a potential surge in the Dollar (fall in the Euro). GLD finished the day near triangle support and the trend is down. RSI never made it above resistance at 60 and remains in bear mode. Notice that the Silver Trust (SLV) moved below its April low and this industrial-precious hybrid is underperforming bullion.
**************************************************************************
Key Economic Reports:
Fri - May 04 - 08:30 - Employment Report
Charts of Interest: Tuesday and Thursday in separate post.
This commentary and charts-of-interest are designed to stimulate thinking. This analysis is not a recommendation to buy, sell, hold or sell short any security (stock ETF or otherwise). We all need to think for ourselves when it comes to trading our own accounts. First, it is the only way to really learn. Second, we are the only ones responsible for our decisions. Think of these charts as food for further analysis. Before making a trade, it is important to have a plan. Plan the trade and trade the plan. Among other things, this includes setting a trigger level, a target area and a stop-loss level. It is also important to plan for three possible price movements: advance, decline or sideways. Have a plan for all three scenarios BEFORE making the trade. Consider possible holding times. And finally, look at overall market conditions and sector/industry performance.

