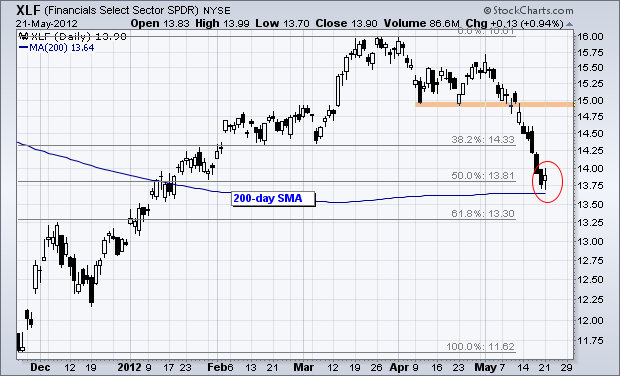
Stocks rebounded on Monday with mid-caps leading the charge and the S&P MidCap 400 SPDR (MDY) surging 3.82% on the day. All sectors were higher with materials, technology, energy and industrials gaining over 2%. Many of the hardest hit sectors and industry groups saw the biggest gains with this snapback rally. The Finance SPDR (XLF) was the exception as this key sector lagged the market with a paltry 1% gain on the day. On the chart below, XLF formed a harami just above the 200-day moving average. This candlestick pattern signals indecision that sometimes foreshadows a short-term reversal. I am not sure if this bounce is coming because the JP Morgan Chase trading loss is likely to increase and the regulation hounds are out in force.
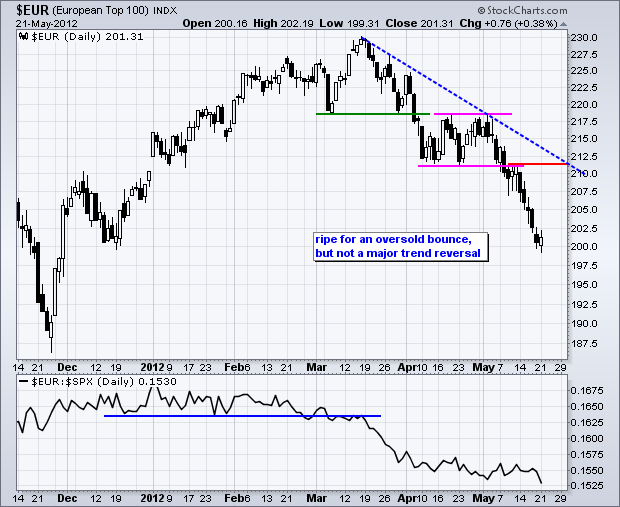
The trio of French, Italian, and Spanish leaders - backed by world powers - are to push for a radical shift in Europe's economic strategy at crucial summit on Wednesday. The package of measures includes an EMU-wide guarantee of bank deposits aimed at halting a slow bank run across southern Europe, as well as demands for full activation of the European Central Bank as a lender of last resort. They will propose eurobonds to finance an infrastructure blitz, a sort of Marshall Plan to revive confidence even if long-term benefits will take years to feed through. While the moves are couched in diplomatic language, the clear aim of French premier François Hollande, Italian premier Mario Monti, and Spanish premier Mariano Rajoy is to wrest control of the EU's governing machinery from Germany. Click here for the full text.
The political battle lines are drawn and there are some big items on the table. I would not expect anything of substance to come out of this summit, but we may get some good sound bites that hint a future action. Anything that hints at a guarantee on bank deposits or the issuance of Euro bonds would be quite positive for the Euro and Euro stocks. Strength across the pond would be bullish for stocks, gold and oil, but bearish for treasuries and the greenback.
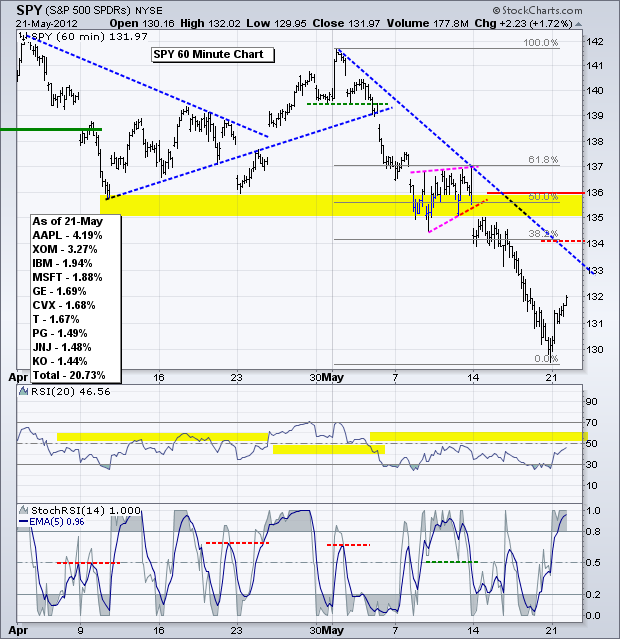
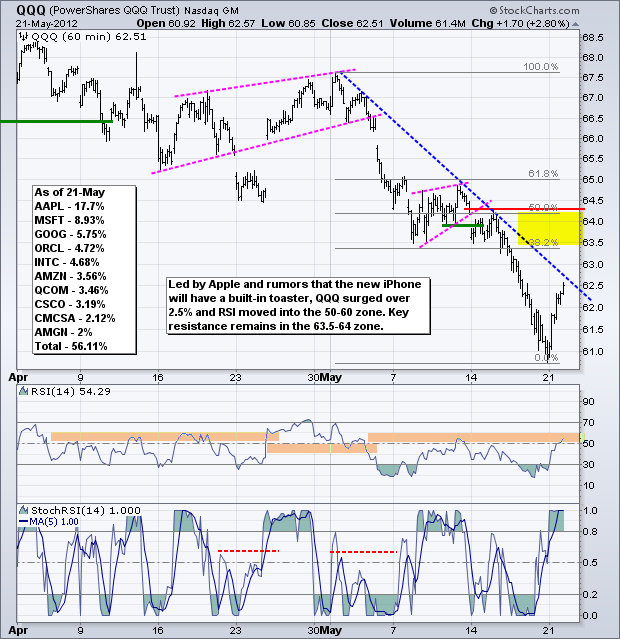
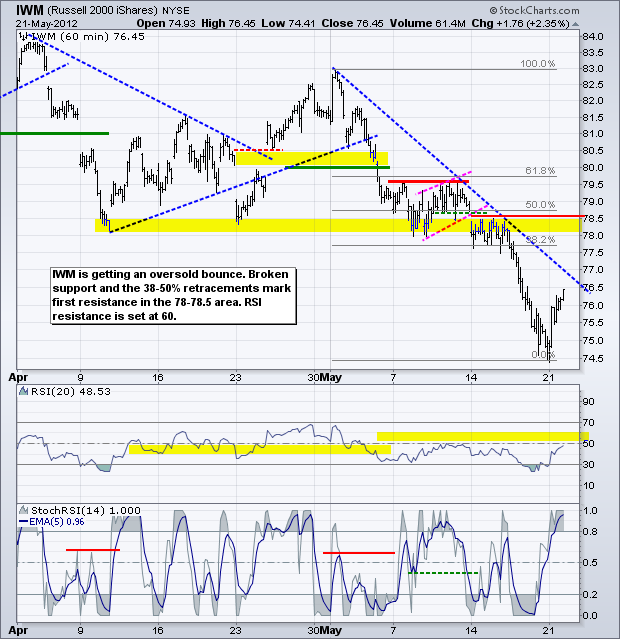
Positive sound bites out of Europe and oversold conditions in US stocks could keep this bounce alive. On the 60-minute chart, the S&P 500 ETF (SPY) surged from 130 to 132 with its biggest gain since mid March. Yes, March 13th was the last time SPY gained more than 1.5% on the day. Nevertheless, it still looks like an oversold bounce within a bigger downtrend. SPY is well below the May trendline and not even close to the key resistance zone around 135-136. I am thinking the ETF will hit first resistance around the 38.2% retracement mark (134) and RSI will hit resistance in the 50-60 zone.
**************************************************************************
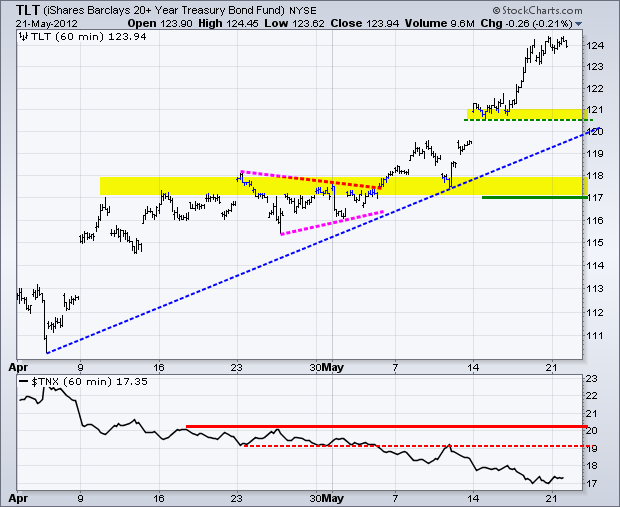
TLT held its gains even as stocks and the Euro moved higher. Despite this show of strength, further gains in stocks and the Euro would likely weigh on the 20+ Year T-Bond ETF (TLT), which is quite overbought. Last week's consolidation marks first support in the 120.5-121 area and key support is now set at 117.
**************************************************************************
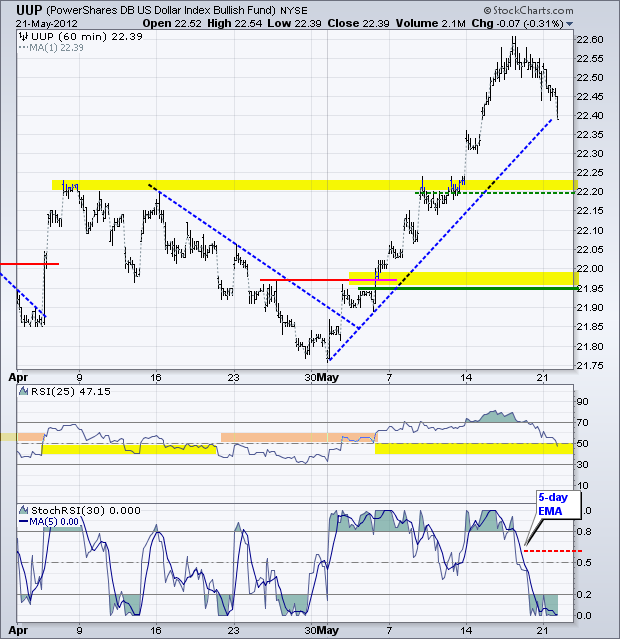
No change. The negative news flow from Europe could ease this week and the Euro could bounce in anticipation of the EU summit. While I am not expecting anything earth shattering, EU leaders will do everything they can to put a positive twist on this summit. The US Dollar Fund (UUP) pulled back from overbought levels on Friday. Nevertheless, the trend is still strong and still up. Broken resistance turns first support in the 22.20 area. Notice how the 5-day EMA for StochRSI moved below .20 to become oversold (dark blue line). A move above .60 would suggest a short-term reversal higher.
**************************************************************************
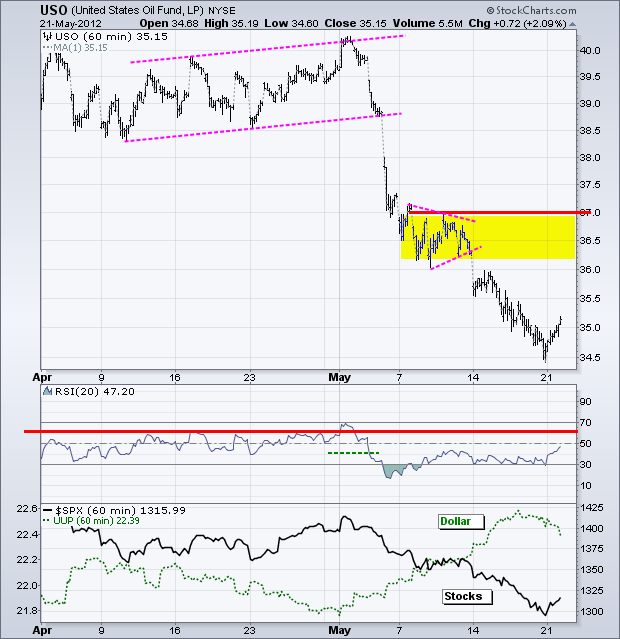
No change. Oil will likely take its cue from stocks and the Euro. A bounce in both would be positive, while declines in both would be negative. The US Oil Fund (USO) is as oversold as the stock market and ripe for a bounce. The pennant formation marks the next resistance level in the 36.50 area. RSI resistance is in the 50-60 zone.
**************************************************************************
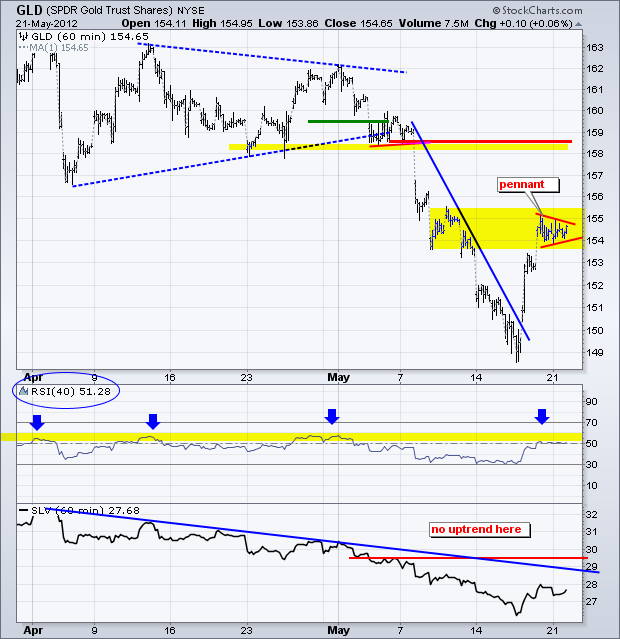
No change. Is this rally for real? We are about to find out. Gold jumped the gun by surging on Thursday and continuing higher on Friday. Stocks and the Euro were both down on Thursday. The Euro bounced on Friday, but stocks finished weak. With this two day surge, the Gold SPDR (GLD) is in its first resistance zone and RSI is in the 50-60 resistance zone. Since late March, GLD has peaked and turned lower when RSI reached this zone. A breakout would be positive and I would then look for a pullback to set up a better risk-reward ratio. The bigger trend remains down, the bottom picking play is over and GLD is currently in no-man's land.
**************************************************************************
Key Economic Reports:
Tue - May 22 - 10:00 - Existing Home Sales
Wed - May 23 - 07:00 - MBA Mortgage Index
Wed - May 23 - 10:00 - New Home Sales
Wed - May 23 - 10:00 - FHFA Housing Price Index
Wed - May 23 - 10:00 – EU Summit
Wed - May 23 - 10:30 - Oil Inventories
Thu - May 24 - 08:30 - Jobless Claims
Thu - May 24 - 08:30 - Durable Orders
Fri - May 25 - 09:55 - Michigan Sentiment
Sun - Jun 17 - 10:00 – Greek Elections
Charts of Interest: Tuesday and Thursday in separate post.
This commentary and charts-of-interest are designed to stimulate thinking. This analysis is not a recommendation to buy, sell, hold or sell short any security (stock ETF or otherwise). We all need to think for ourselves when it comes to trading our own accounts. First, it is the only way to really learn. Second, we are the only ones responsible for our decisions. Think of these charts as food for further analysis. Before making a trade, it is important to have a plan. Plan the trade and trade the plan. Among other things, this includes setting a trigger level, a target area and a stop-loss level. It is also important to plan for three possible price movements: advance, decline or sideways. Have a plan for all three scenarios BEFORE making the trade. Consider possible holding times. And finally, look at overall market conditions and sector/industry performance.

