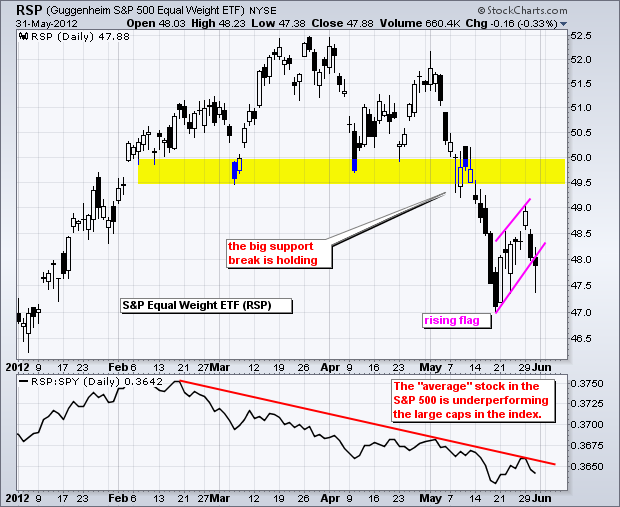
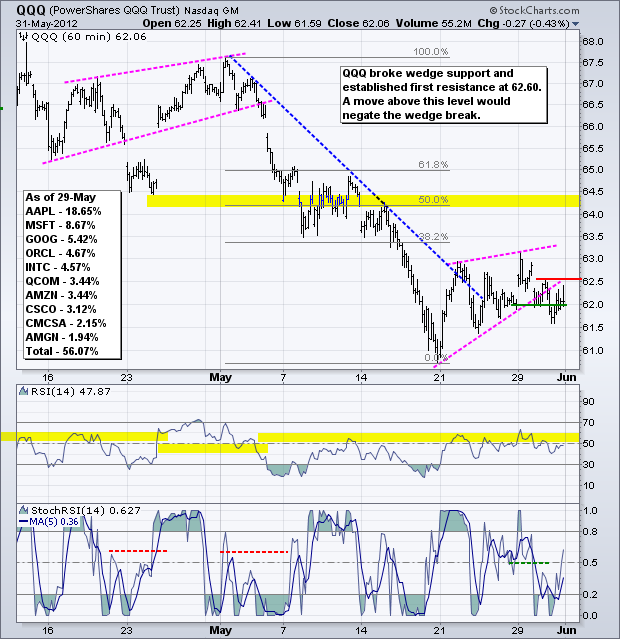
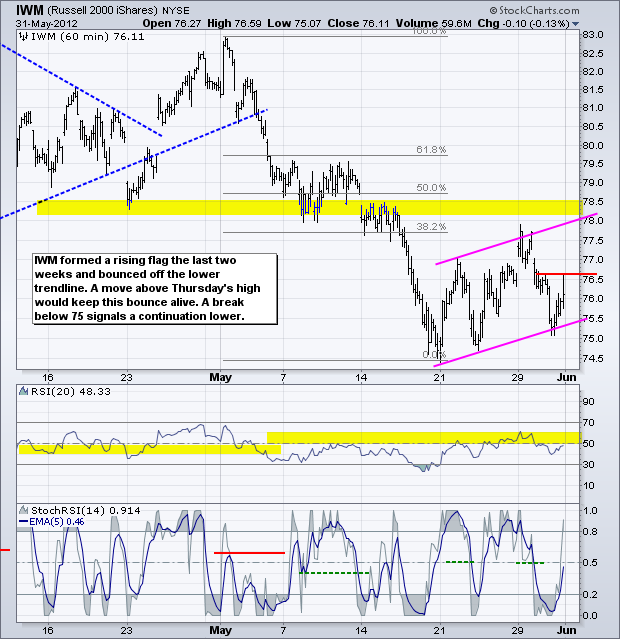
Stocks were mixed and directionless on Thursday. Concerns in Europe and worse-than-expected economic reports buoyed the bears, while the prospects of further quantitative easing from the European Central Bank (ECB) and Fed put a bid in stocks. Don't be surprised if we see some big announcement out of Europe that pushes stocks higher for a few days. And don't be surprised if this is just a pop within a bigger downtrend. On the Rydex S&P Equal Weight ETF (RSP) chart below, the neckline break is holding and a rising flag formed in late May. Also notice that the equal-weight ETF is underperforming the market-cap weighed ETF (SPY). This means small-caps and mid-caps show relative weakness.
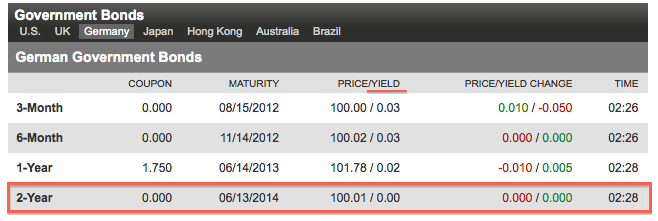
Money continues its march into US treasuries and German government bonds. The yield on the 2-year German bond, known as the schatz, briefly dipped below zero in early trading on Friday. This means investors were paying the German government for the right to park their money. The yield on the 10-year German Bund fell to 1.19%, its lowest level ever. Yields in other safe havens, like Finland, also declined to record low levels. These record low yields point to some serious concerns in the global economy and perhaps even the threat of deflation. Also note that China's official PMI fell to 50.4, which suggests that the Chinese economy is barely growing.
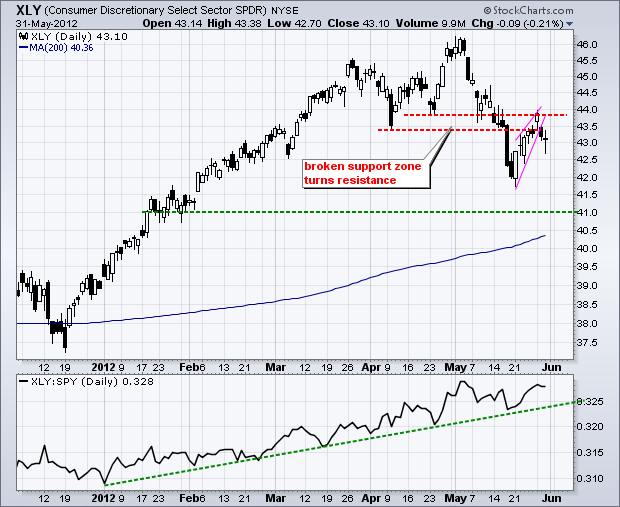
Economic reports in the US are still coming up a little short. The Chicago PMI fell to 52.7, which still shows expansion because it is above 50. However, analysts expected a reading around 56.5 and the actual reading fell well short of expectations. First quarter GDP was also soft as the economy grew by just 1.9%. This number was down from the first estimate of 2.2%. Jobless claims edged higher and have not risen seven of the last eight weeks. The ADP Employment report was also lackluster. Given the uncertainty over Europe and the coming US election, I would not be surprised to see businesses put hiring plans on hold until 2013.
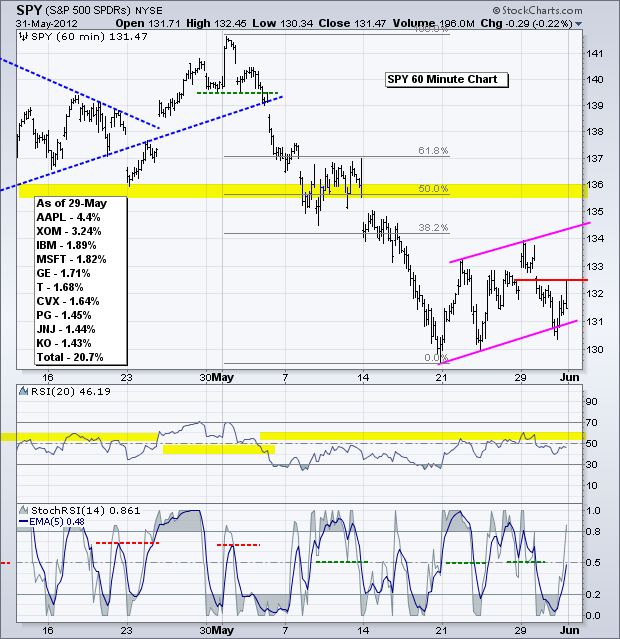
Volatility could be high again today as we await an important employment report. A worse-than-expected number would likely send stocks sharply lower and treasuries even higher. A better-than-expected number would be positive for stocks and negative for treasuries. Given the recent spate of worse-than-expected economic reports, I think today's employment report is unlikely to beat expectations. On the 60-minute chart, the S&P 500 ETF (SPY) tested the lower trendline of the rising flag. Another break below 131 would signal a continuation lower. The ETF established a short-term resistance level with the spike high at 132.60. A break above this level would argue for an extension of the oversold bounce.
**************************************************************************
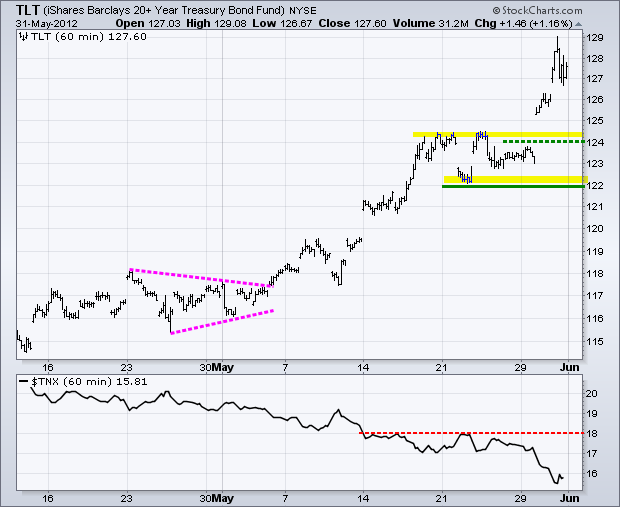
The 20+ Year T-Bond ETF (TLT) surged to another 52-week high with the move above 128. Broken resistance turns into first support around 124. Last week's lows mark key support at 122. The 10-year Treasury Yield ($TNX) moved below 1.6%, its lowest level in 60 years.
**************************************************************************
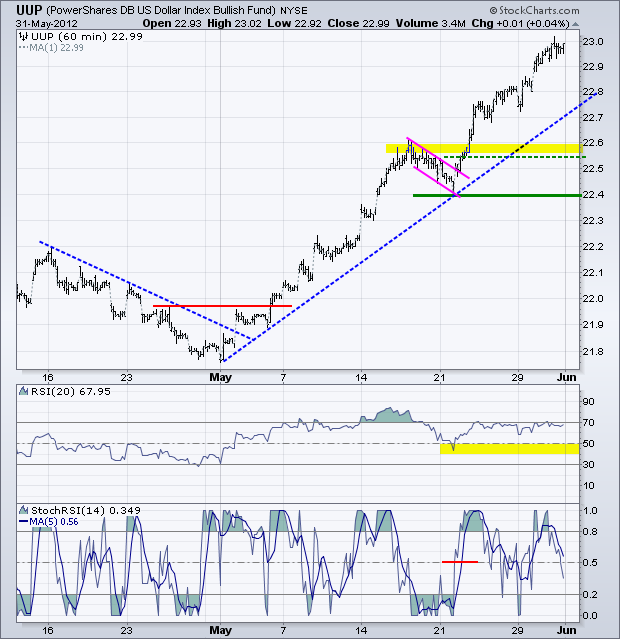
No change. The US Dollar Fund (UUP) started strong and finished strong. UUP remains overbought and the Euro remains oversold, but Forex traders are not buying Euros because there is so much uncertainty on the horizon (Greece, Portugal and Spain). Broken resistance remains first support in the 22.55-22.6 area and key support remains at 22.40.
**************************************************************************
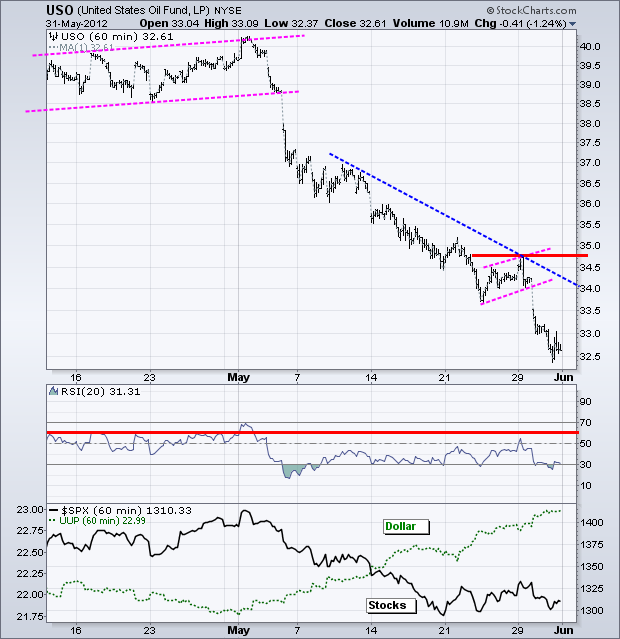
No change. Falling oil prices will help consumers, but falling oil prices suggest weakness in oil demand and the economy. Oil is also being hit by a strong Dollar and weak stock market. The US Oil Fund (USO) broke flag support and closed at its lowest level since mid October. Overall, USO is down over 15% this month and showing no signs of a rebound, despite being massively oversold.
**************************************************************************
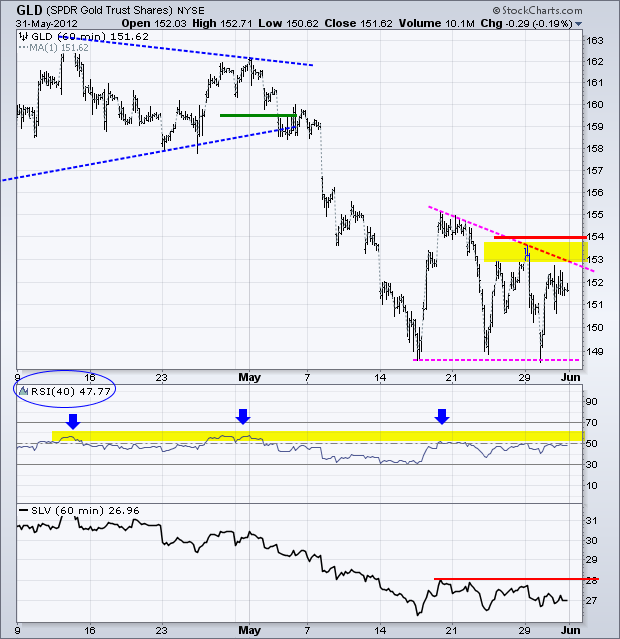
The Gold SPDR (GLD) bounced off support, but has yet to exceed this week's high. This is, however, support in a downtrend and the odds favor a support break when the trend is down. Also note that a descending triangle is taking shape and a break below the May lows would target a move to 143. The height of the pattern (155 – 149 = 6) is subtracted from the break for a target. I am going on a limb and moving key resistance to 154. A break above 54 in GLD and 60 in 40-period RSI would reverse the short-term downtrend in GLD.
**************************************************************************
Key Economic Reports:
Fri - Jun 01 - 08:30 - Employment Report
Fri - Jun 01 - 10:00 - ISM Manufacturing Index
Fri - Jun 01 - 10:00 - Construction Spending
Fri - Jun 01 - 14:00 - Auto/Truck Sales
Sun - Jun 04 - 10:00 – Greek Holiday
Sun - Jun 17 - 10:00 – Greek Elections
Sun - Jun 28 - 10:00 – 2-day EU Summit
Charts of Interest: Gone fishing until Tuesday ....
This commentary and charts-of-interest are designed to stimulate thinking. This analysis is not a recommendation to buy, sell, hold or sell short any security (stock ETF or otherwise). We all need to think for ourselves when it comes to trading our own accounts. First, it is the only way to really learn. Second, we are the only ones responsible for our decisions. Think of these charts as food for further analysis. Before making a trade, it is important to have a plan. Plan the trade and trade the plan. Among other things, this includes setting a trigger level, a target area and a stop-loss level. It is also important to plan for three possible price movements: advance, decline or sideways. Have a plan for all three scenarios BEFORE making the trade. Consider possible holding times. And finally, look at overall market conditions and sector/industry performance.

