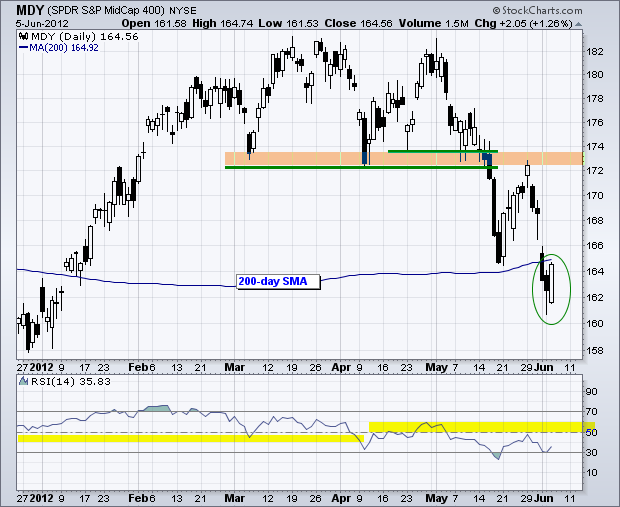
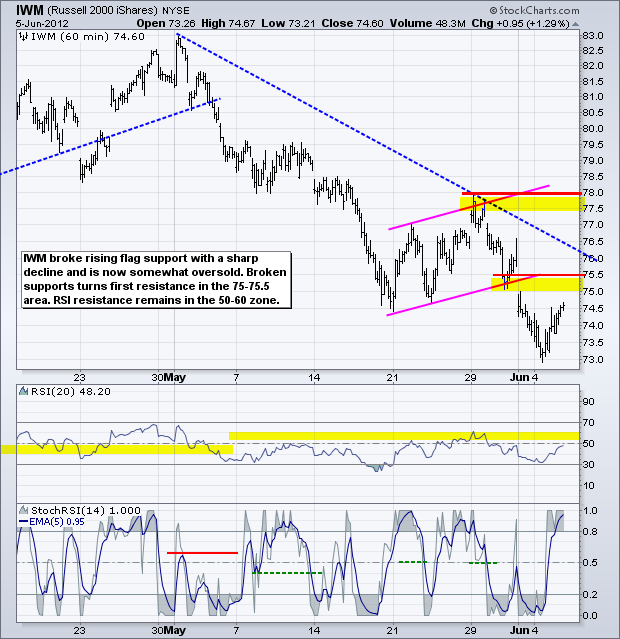
Stocks bounced on Monday with small-caps and mid-caps leading the way. The Russell 2000 ETF (IWM) gained around 1% and the S&P MidCap 400 SPDR (MDY) surged 2.05%. The chart below shows MDY forming a bullish engulfing as it surged back towards its 200-day moving average. While follow through would certainly be positive, I still view this as an oversold bounce within a bigger downtrend. Look for resistance when (if) RSI reaches the 50-60 zone. The 40-50 zone provides support in an uptrend, while the 50-60 zone acts as resistance in a downtrend.
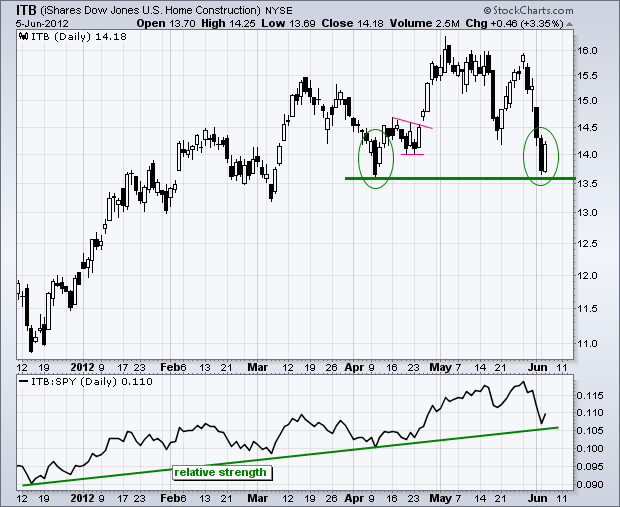
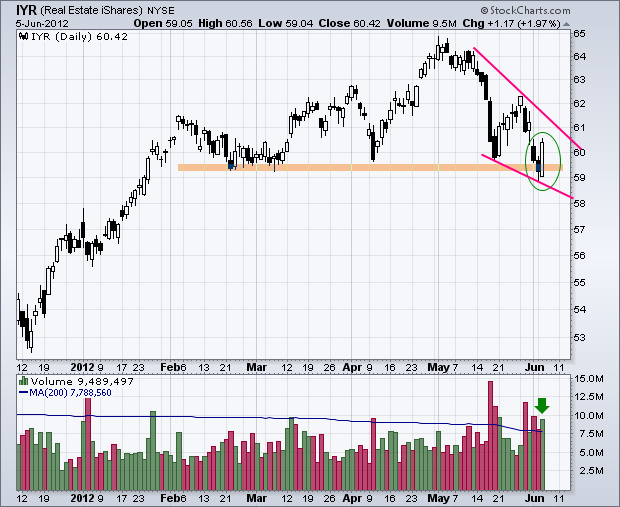
Eight of the nine sector SPDRs were higher with the Finance SPDR (1.65%) leading the way. The Consumer Staples SPDR (XLP) was the lone loser with a fractional loss. Homebuilders and REITs, which led the market in April, posted strong gains. The Home Construction iShares (ITB) formed a piercing pattern at support from the April low. Notice that a harami signaled support at the April low. The Real Estate iShares (IYR) formed a bullish engulfing to affirm support from the February-April lows. Volume was also above average.
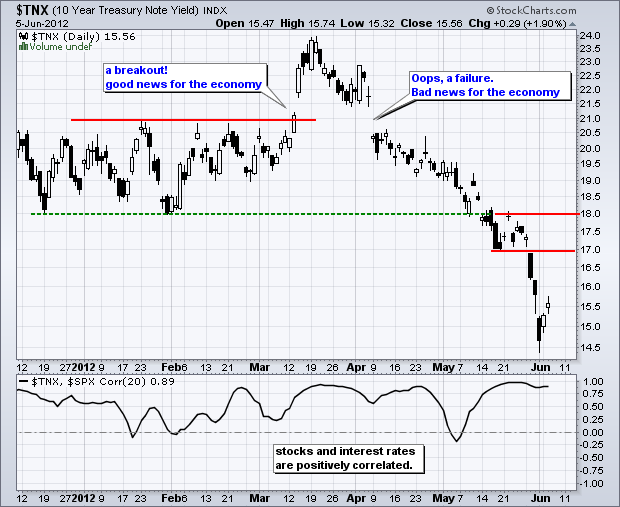
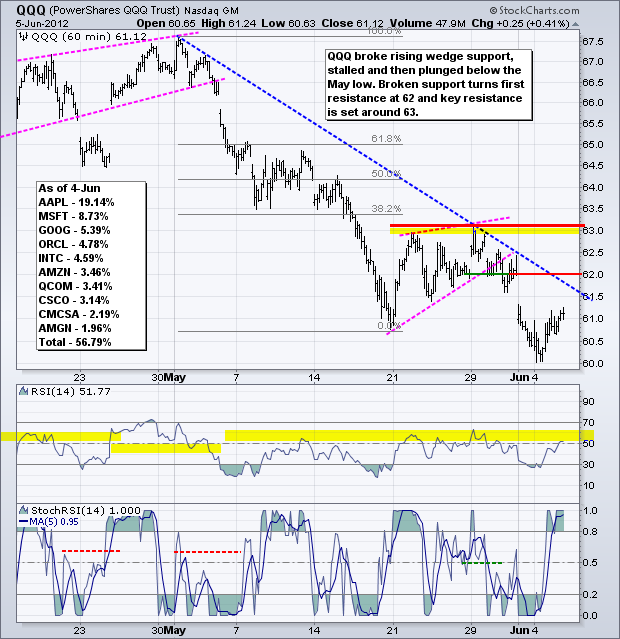
Why are the markets suddenly getting excited? Keep in mind that stocks were short-term oversold on Friday and ripe for some sort of bounce. Even though the bigger trend remains down, the "powers that be" will throw the kitchen sink at the market to prevent a meltdown like 2008. The rumor wagons are circling as Spain cries out for help and the US economy stumbles. The European Central Bank (ECB) meets today and could move to a more dovish stance on interest rates and quantitative easing. Fed Chairman Bernanke testifies before congress on Thursday and could also throw a QE3 bone to the market. The Fed has state many times that it stands ready to act should economic circumstances warrant. Well, the majority of economic reports have been below expectations and job growth is anemic. Thrown in an EU recession and China slowdown, and it looks like the Fed has plenty of reasons to act. While this may not solve the long-term problems or reverse the bigger downtrend, it could be enough to produce an oversold liquidity bounce. The breakdown in the 10-year Treasury Yield ($TNX) over the last two months suggests more easing on the horizon.
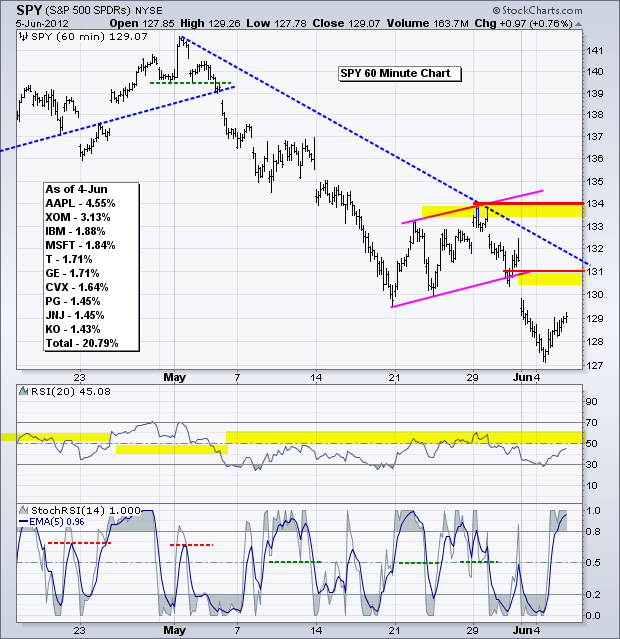
On the 60-minute chart, the S&P 500 ETF (SPY) became oversold near 127 and bounced back above 129 this week. The first resistance zone is coming into play from broken supports that extend from 129.5 to 131. Also notice resistance from the gap zone around 130-131. In the indicator window, I would expect RSI to hit resistance in the 50-60 zone.
**************************************************************************
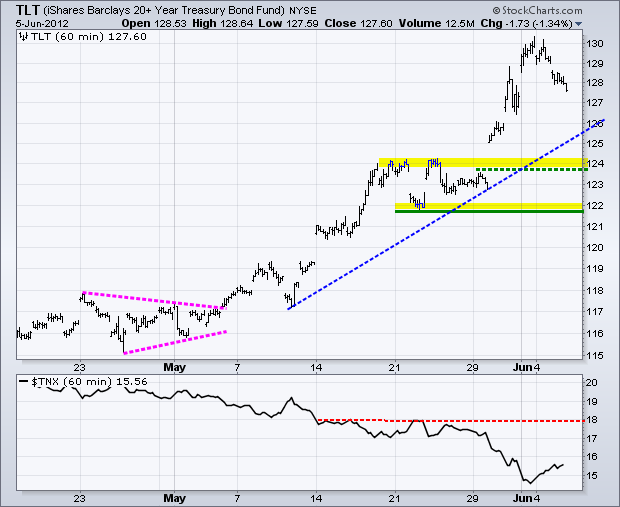
Treasuries were as overbought as stocks were oversold. After surging from 122 to 130 in two weeks (6.5%), the 20+ Year T-Bond ETF (TLT) backed off with a decline below 128. A deeper pullback would be positive for stocks, oil and the Euro. However, this is still just a correction within a bigger uptrend.
**************************************************************************
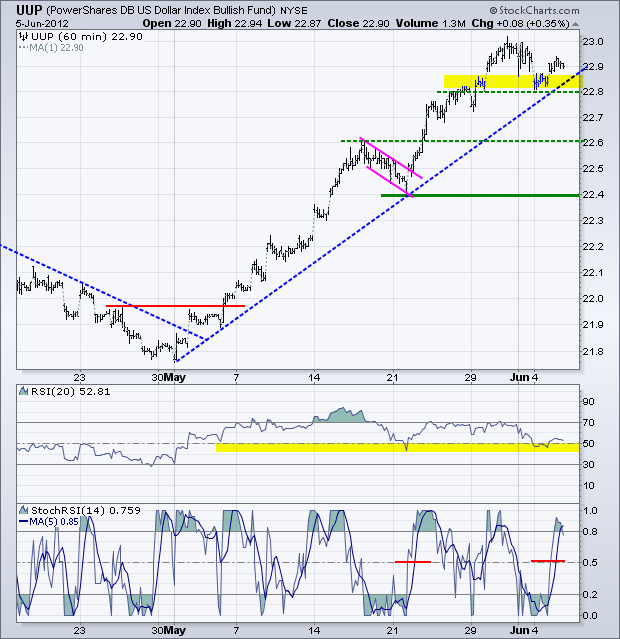
Even though treasuries moved lower and stocks moved higher, the Dollar moved higher and the Euro edged lower. Normally, a rise in the Dollar and fall in the Euro favors the risk off trade. This was probably an anomaly and I would expect any weakness in the Euro to re-trigger the risk off trade. On the price chart, UUP established short-term support at 22.8 and RSI is trading in its support zone (40-50). A break below 22.8 would argue for a correction of the May advance. We might then see a move towards the 22.60 area.
**************************************************************************
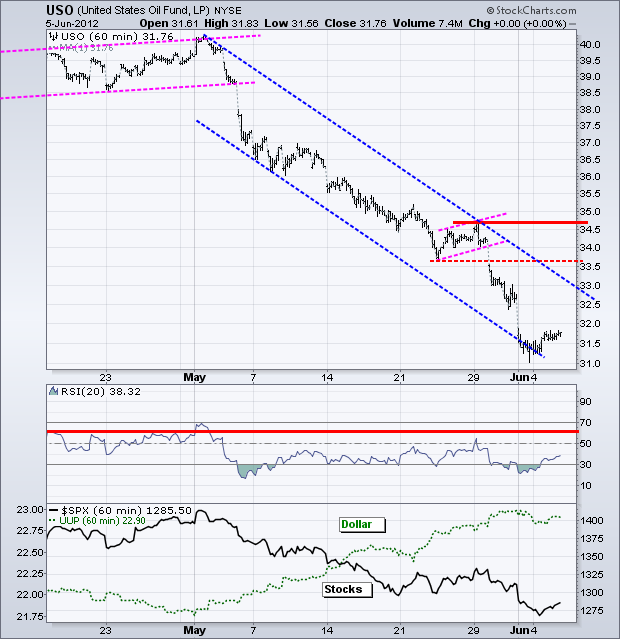
The US Oil Fund (USO) hit the lower trendline of a falling channel and firmed the last few days. Even though this week's bounce was rather feeble, continued strength in stocks could keep the oversold bounce alive. A move back to the upper trendline or even towards broken support in the 33.50 area is possible. Expect RSI to hit resistance in the 50-60 zone on any oversold bounce.
**************************************************************************
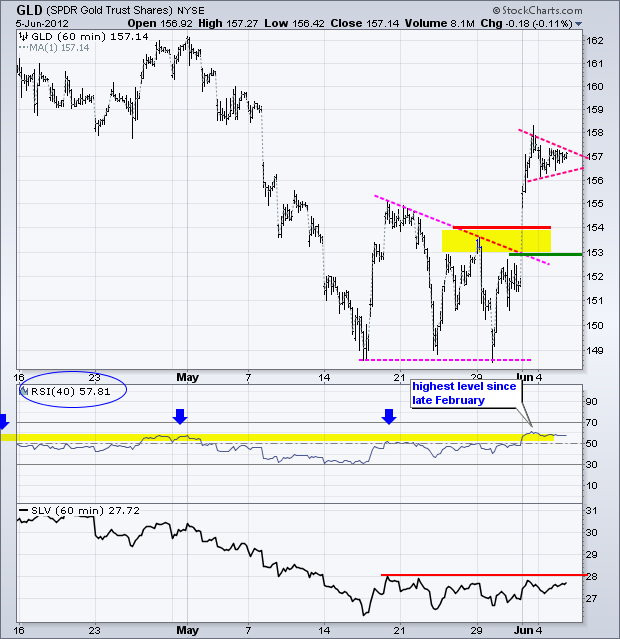
The Gold SPDR (GLD) surged above resistance with a big move last week and then consolidated. RSI confirmed this breakout with a move above 60 for the first time since late February. GLD consolidated after the breakout with a pennant forming the last two days. A break above pennant resistance would signal a continuation higher and target further strength towards the 161-162 area. A break below pennant support argues for a pullback to broken resistance in the 154-155 area. Bloomberg reported that George Soros added to his gold positions in Q1 and that hedge-fund manager John Paulson remains with a big position in GLD.
**************************************************************************
Key Economic Reports:
Wed - Jun 06 - 07:00 - MBA Mortgage Index
Wed - Jun 06 - 08:30 – ECB Policy Statement
Wed - Jun 06 - 10:30 - Oil Inventories
Wed - Jun 06 - 14:00 - Fed Beige Book
Thu - Jun 07 - 08:30 - Jobless Claims
Thu - Jun 07 - 08:30 – Bernanke Appears before Congress
Sun - Jun 17 - 10:00 – Greek Elections
Sun - Jun 28 - 10:00 – 2-day EU Summit
Charts of Interest: Tuesday and Thursday
This commentary and charts-of-interest are designed to stimulate thinking. This analysis is not a recommendation to buy, sell, hold or sell short any security (stock ETF or otherwise). We all need to think for ourselves when it comes to trading our own accounts. First, it is the only way to really learn. Second, we are the only ones responsible for our decisions. Think of these charts as food for further analysis. Before making a trade, it is important to have a plan. Plan the trade and trade the plan. Among other things, this includes setting a trigger level, a target area and a stop-loss level. It is also important to plan for three possible price movements: advance, decline or sideways. Have a plan for all three scenarios BEFORE making the trade. Consider possible holding times. And finally, look at overall market conditions and sector/industry performance.

About the author:
Arthur Hill, CMT, is the Chief Technical Strategist at TrendInvestorPro.com. Focusing predominantly on US equities and ETFs, his systematic approach of identifying trend, finding signals within the trend, and setting key price levels has made him an esteemed market technician. Arthur has written articles for numerous financial publications including Barrons and Stocks & Commodities Magazine. In addition to his Chartered Market Technician (CMT) designation, he holds an MBA from the Cass Business School at City University in London.
Learn More
