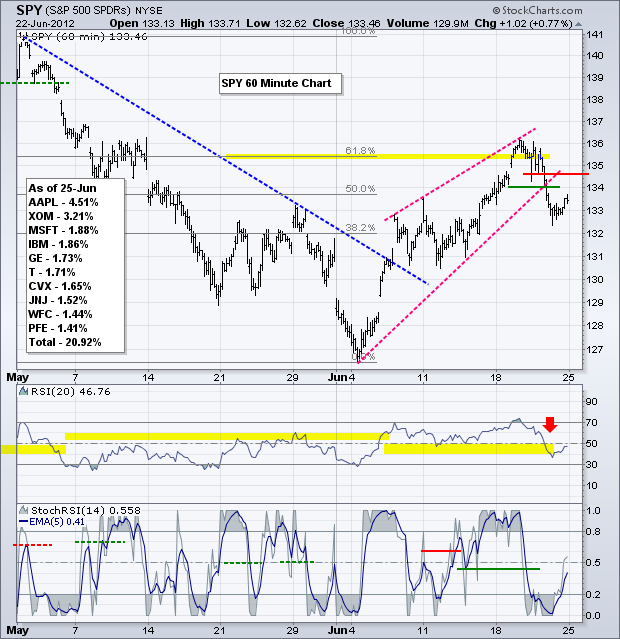
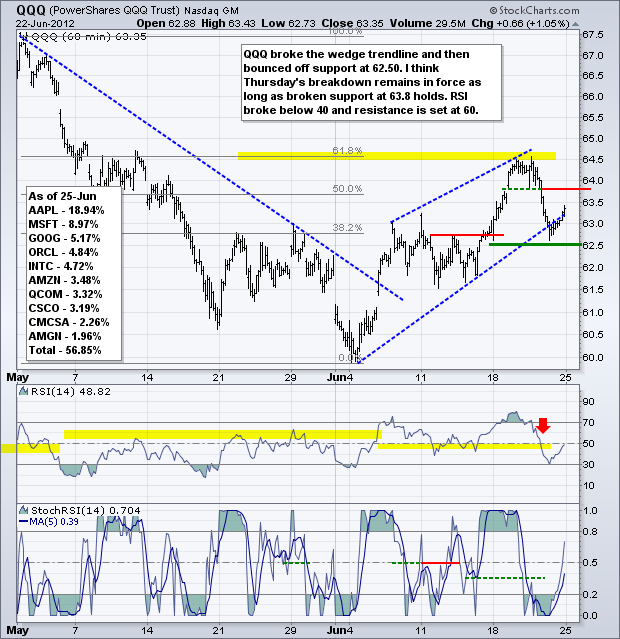
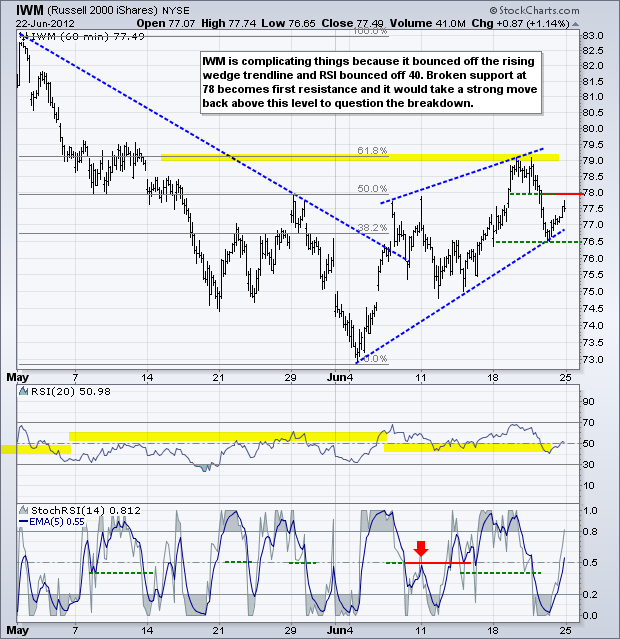
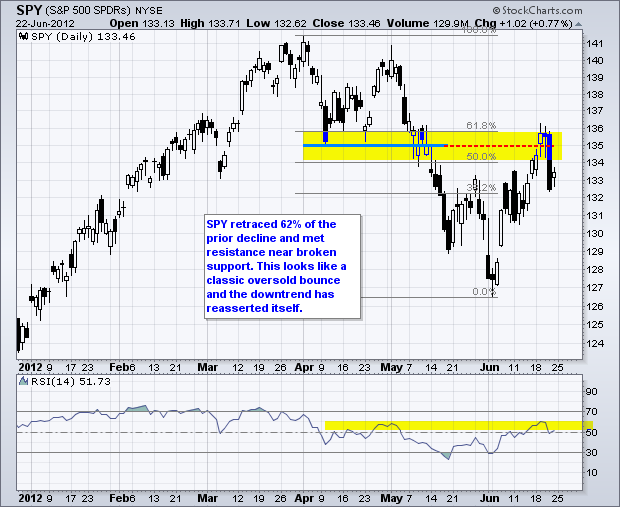
It is shaping up to be another big week on Wall Street and in Europe. On the news front, we have some key economic reports, another critical EU Summit and a potential ruling on healthcare reform. On the technical front, note that the major index ETFs failed at broken support levels and the 61.80% retracement lines with Thursday's sharp decline. Even though stocks firmed on Friday and inside days formed, last week's high could mark a significant peak. At worst, the bigger downtrend is continuing, which means the major index ETFs will move below their early June lows.
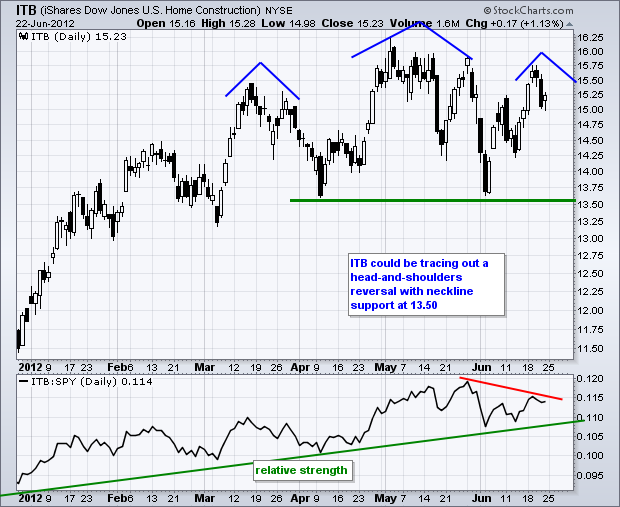
Homebuilders will be in the spotlight on Monday as the Census Bureau releases New Home Sales (May) at 10AM ET. Consensus estimates call for an increase of 7000. Anything below expectations would likely weigh on the Home Construction iShares (ITB), which is looking toppy. This group led the market from January to early May, but has started showing relative weakness in June. Notice how the Price Relative formed a lower high and a potential head-and-shoulders is taking shape on the price chart.
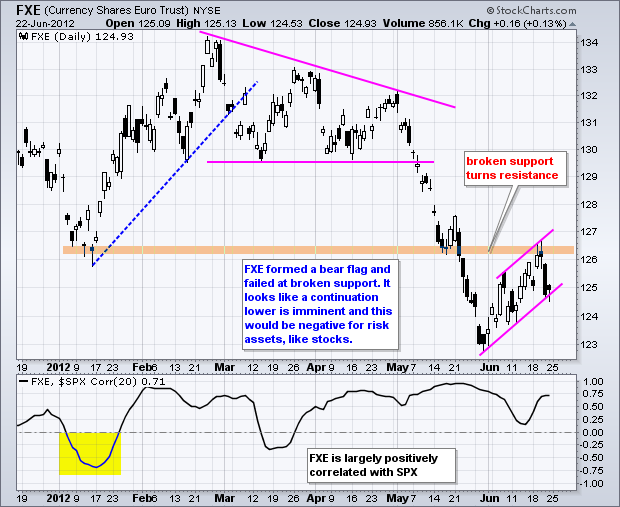
Is this the week that will make-or-break the Euro? George Soros and Italian Prime Minister Mario Monti think so. Speaking on the upcoming EU summit, Monti warned of "apocalyptic consequences" if leaders fail to act and Soros suggested that the Euro may "dissolve" is leaders fail to stem the debt crisis. To top it off, Greece's new leaders will not attend the summit because of health concerns. Handicapping this summit and the Euro is tricky because EU leaders always do just enough to kick the can down the road a little further. The market bought into these stop-gap measures in the past, but this seems to be changing its attitude. The market now wants something big, such as an integrated banking system, debt guarantee program or Euro bonds. There is just one problem. The markets want these long overdue reforms next week, but these things take time, such a several months, to finalize.
The S&P 500 ETF (SPY) broke rising wedge support with a sharp decline and this break remains the dominant chart feature. Broken support in the 134-134.3 area turns into the first resistance level to watch. A sharp surge back above 134.3 would suggest a failed breakout. The mid June lows mark the next support zone in the 130.5-131 area. RSI broke below 40 to turn momentum bearish and 60 becomes resistance.
**************************************************************************
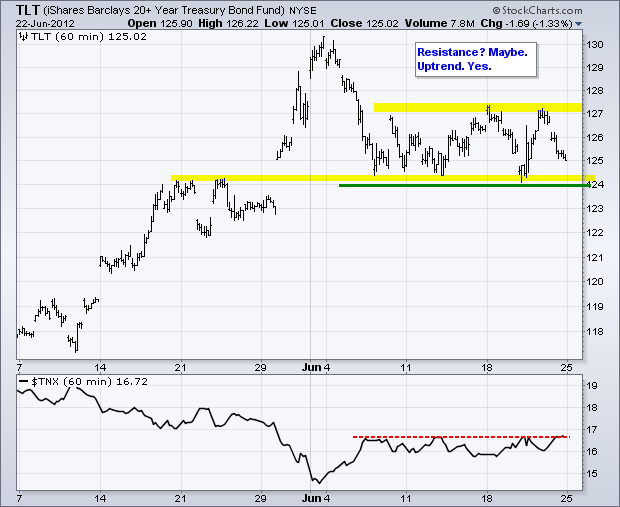
Stocks and the Euro are driving the treasury market right now. Weakness in one or both is bullish for the 20+ Year T-Bond ETF (TLT). Strength in one or both is bearish. With stocks and the Euro positively correlated, we will most likely see these two moving together and TLT moving in the opposite direction. On the price chart, TLT remains in a medium-term uptrend and short-term consolidation. With the recent breakdown in SPY and bear flag in FXE, the odds favor an upside breakout in TLT.
**************************************************************************
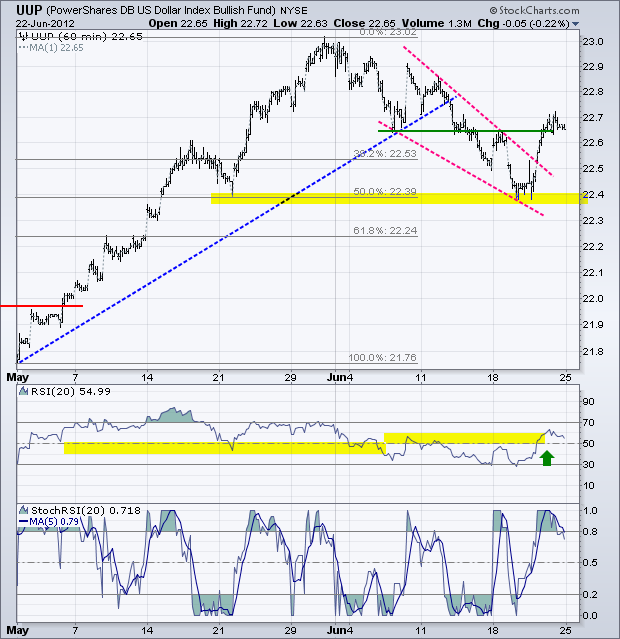
The US Dollar Fund (UUP) broke falling wedge resistance as the S&P 500 ETF (SPY) broke rising wedge support. This breakout reverses the June slide and signals a continuation of the May advance. The trendline break around 22.5 becomes the first support level to watch. RSI broke above 60 to turn momentum bullish and 40 now becomes support. The news cycle will be focused on the EU this week with the EU summit on Thursday and Friday.
**************************************************************************
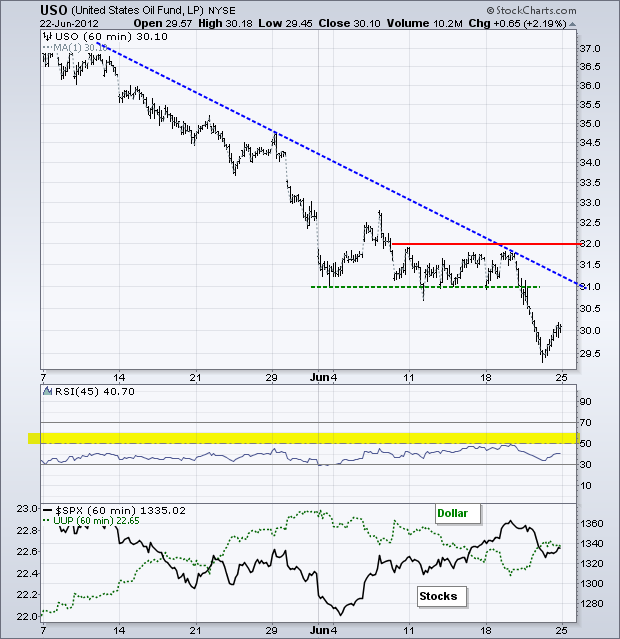
The US Oil Fund (USO) is a risky asset that will benefit from strength in the Euro and the stock market. Conversely, it will decline should the stock market and Euro decline. The trend for USO remains firmly down after a support break at 31 and continuation lower. The mid June highs mark key resistance at 32. The Middle East remains a wild card for oil, but the market has yet to turn its attention away from the US economy and the EU debt crisis. Events in Syria show no improvement and nuclear talks with Iran stalled last week. Iran is certainly not happy with the fall in oil prices.
**************************************************************************
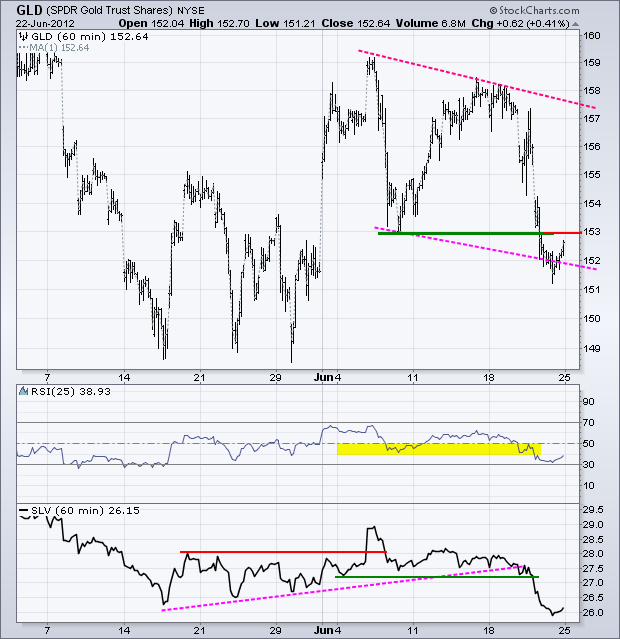
Gold and silver broke down last week as the Dollar rebounded and stocks plunged. The Gold SPDR (GLD) surged in early June, but failed to follow through and moved back below 153 last week. The trend is now down after the failed breakout. Notice that GLD traced out a series of lower highs and lower lows in June. This volatile zigzag lower could be a massive flag. A break back above 153 would provide the early signal of strength. It would take a break above 158 to fully reverse the downtrend though.
**************************************************************************
Key Reports and Events:
Mon - Jun 25 - 10:00 - New Home Sales
Mon - Jun 25 - 10:00 – Supreme Court Healthcare Ruling?
Tue - Jun 26 - 09:00 - Case-Shiller 20-city Index
Tue - Jun 26 - 10:00 - Consumer Confidence (Conference Board)
Wed - Jun 27 - 08:30 – Durable Goods Orders
Wed - Jun 27 - 10:00 - Pending Home Sales
Wed - Jun 27 - 10:30 - Oil Inventories
Thu - Jun 28 - 08:30 – Initial Jobless Claims
Thu - Jun 28 - 08:30 – GDP
Thu - Jun 28 - 08:30 – Supreme Court Healthcare Ruling?
Thu - Jun 28 – 08:30 – 2-day EU Summit Begins
Fri - Jun 29 - 08:30 - Personal Income & Spending
Fri - Jun 29 - 09:45 - Chicago Purchasing Managers Index (PMI)
Fri - Jun 29 - 09:55 - Michigan Sentiment
Fri - Jun 29 - 12:00 – 2-day EU Summit Ends
Thu - Jul 05 - 10:00 – European Central Bank Policy Statement
Charts of Interest: Tuesday and Thursday
This commentary and charts-of-interest are designed to stimulate thinking. This analysis is not a recommendation to buy, sell, hold or sell short any security (stock ETF or otherwise). We all need to think for ourselves when it comes to trading our own accounts. First, it is the only way to really learn. Second, we are the only ones responsible for our decisions. Think of these charts as food for further analysis. Before making a trade, it is important to have a plan. Plan the trade and trade the plan. Among other things, this includes setting a trigger level, a target area and a stop-loss level. It is also important to plan for three possible price movements: advance, decline or sideways. Have a plan for all three scenarios BEFORE making the trade. Consider possible holding times. And finally, look at overall market conditions and sector/industry performance.

