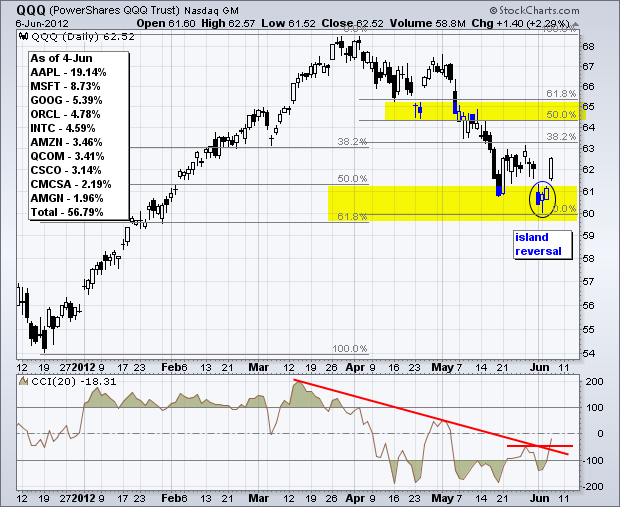
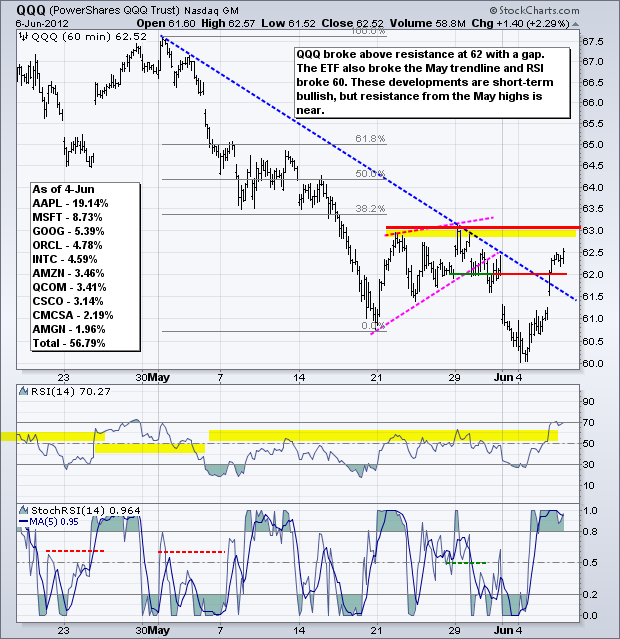
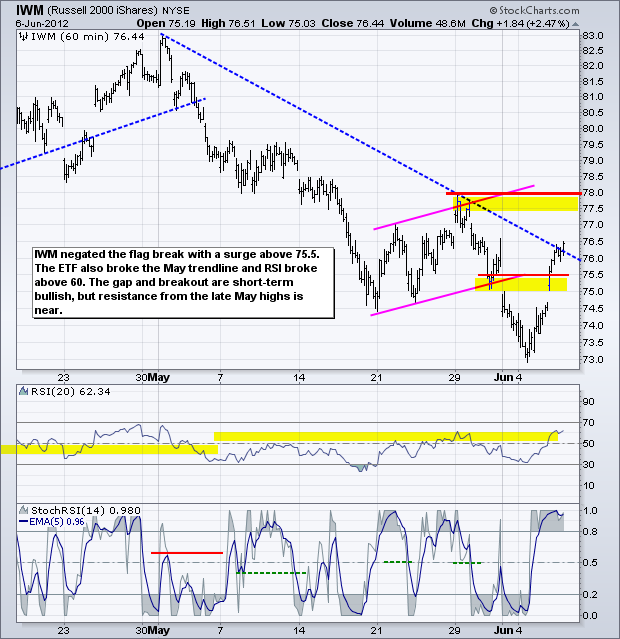
It was a classic stimulus-response rally on Wednesday. Wait, I did not see any actual stimulus. In reality, the market was anticipating stimulus in Europe, the US and elsewhere around the world. Rumors abound that the EU is poised to rescue Spanish banks and implement some sort of Euro-wide banking plan. A big idea, but we have yet to see details. Fed chairman Bernanke is schedule to testify before congress today and there are hopes that he will hint at more quantitative easing. And then there is the European Central Bank (ECB), which said it stands ready to act should circumstances permit. It all sounds good, but I keep asking myself: where's the beef? Nevertheless, stocks surged on these prospects with the major index ETFs gaining over 2%. The Nasdaq 100 ETF (QQQ) gapped up and formed an island reversal over the last five days. While such price action is short-term bullish, I think it is still within the context of a bigger downtrend.
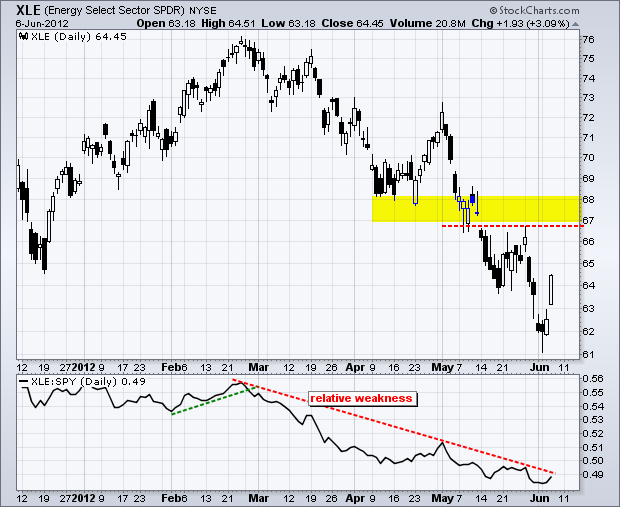
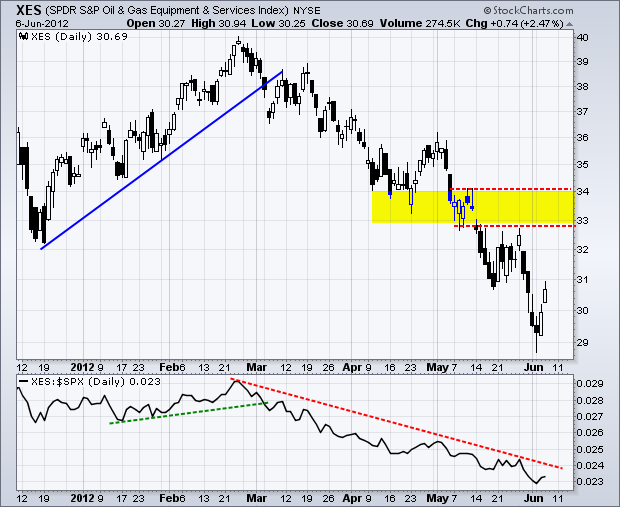
All nine sectors were higher with the Finance SPDR (XLF) and the Energy SPDR (XLE) leading the charge. A rescue of Spanish banks and an EU banking initiative would certainly reduce global risk for the big US banks. Energy surged as oversold oil bounced back above $85. Even so, XLE remains in a clear downtrend and this looks like an oversold bounce. The late May high and broken support mark the first resistance zone around 67-68.
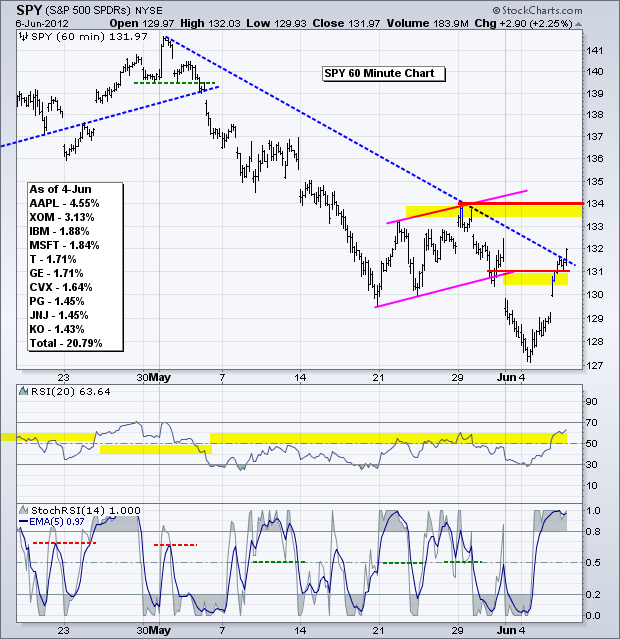
On the 60-minute chart, the S&P 500 ETF (SPY) gapped up and broke resistance at 131 to negate the flag break. The ETF also broke the early May trendline and RSI moved above 60 for the first time since early May. Even though a bigger resistance level resides in the 133-134 area, these breakouts argue for a short-term uptrend. What now? SPY is already short-term overbought after a surge from 127 to 132. Buying now would be chasing the market as it nears resistance from the late May highs. This looks like no-man's land. The gap-breakout provides a short-term bullish bias, but resistance is near and stocks are already short-term overbought.
**************************************************************************
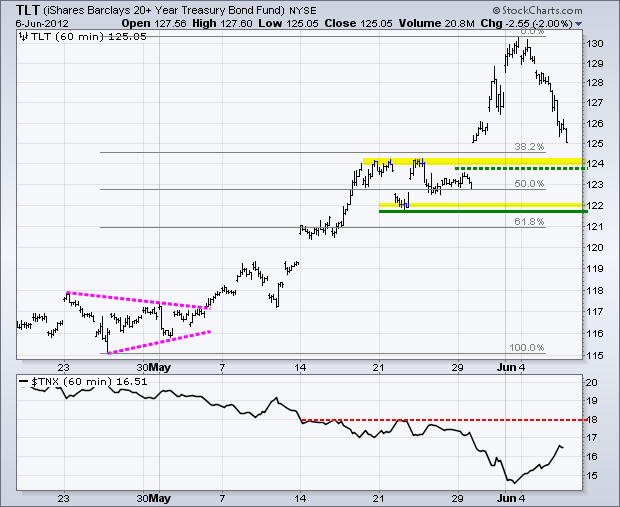
Overbought treasuries took it on the chin as the market embraced a little risk on Wednesday. The 20+ Year T-Bond ETF (TLT) plunged around 3.8% the last three days and is nearing its first support zone around 124. Support here stems from broken resistance.
**************************************************************************
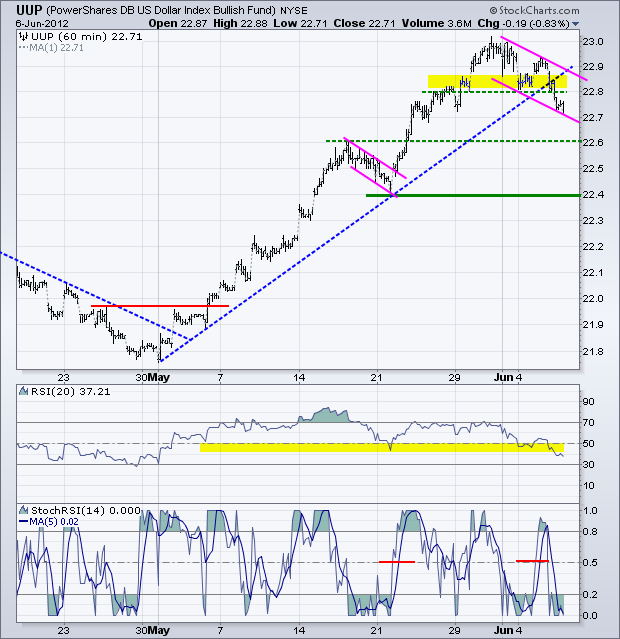
A rise in the Euro helped the risk-on trade and the US Dollar Fund (UUP) broke below first support at 22.80. This is short-term negative, but I am not ready to turn short-term bearish on the greenback just yet. As with treasuries, the Dollar was overbought and ripe for a correction. The current decline looks like a falling flag with resistance at 22.90. Broken resistance marks the next support zone around 22.60
**************************************************************************
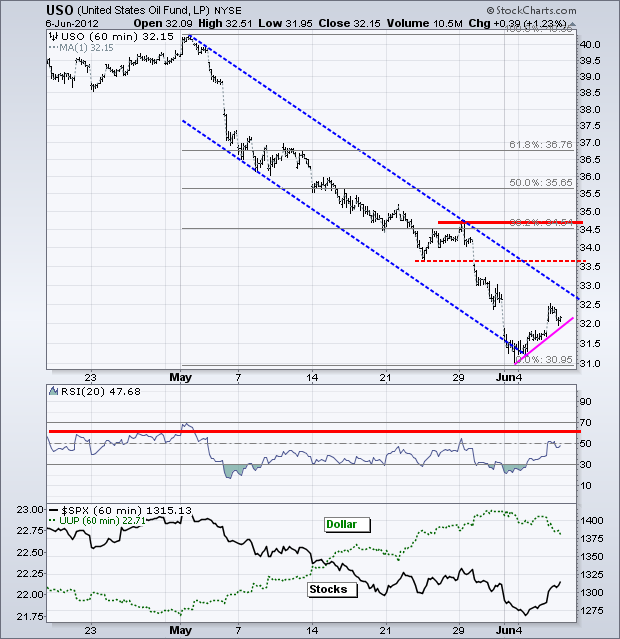
The US Oil Fund (USO) bounced along with stocks and the Euro. After hitting the lower trendline of a falling channel and becoming oversold, USO edged above 32 with a rather feeble advance the last three days. Given strength in stocks, I expected a little more out of this key commodity. Nevertheless, USO is likely to hold its gains as long as stocks and the Euro continue their oversold bounce.
**************************************************************************
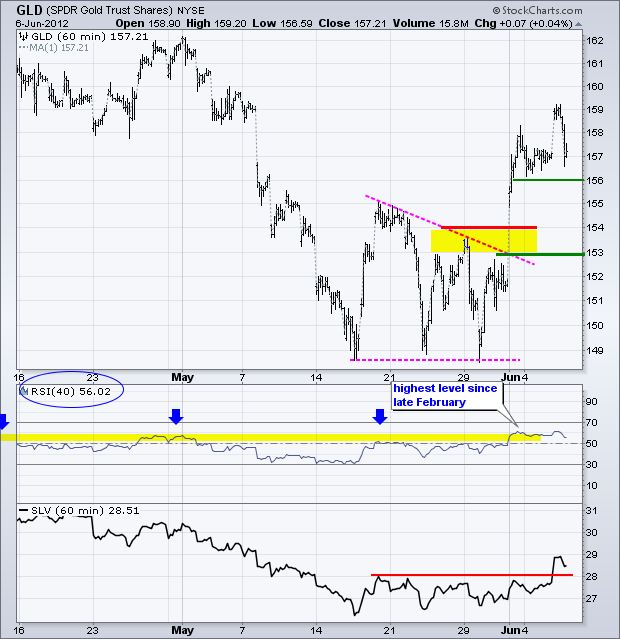
Gold is certainly a strange. Gold was positively correlated with the stock market and the Euro in May. Last Friday gold surged even as the stock market and Euro plunged. Stocks and the Euro rebounded this week, but gold failed to move higher. Perhaps gold made its move on Friday and stocks were just catching up. In any case, price action is a little strange. First support is set at 156 and a break below this level would argue for a pullback towards the resistance break. I will leave key support at 153 for now. Note that ABX formed a large bearish engulfing on Wednesday.
**************************************************************************
Key Economic Reports:
Thu - Jun 07 - 08:30 - Jobless Claims
Thu - Jun 07 - 08:30 – Bernanke Appears before Congress
Sun - Jun 17 - 10:00 – Greek Elections
Sun - Jun 28 - 10:00 – 2-day EU Summit
Charts of Interest: Tuesday and Thursday
This commentary and charts-of-interest are designed to stimulate thinking. This analysis is not a recommendation to buy, sell, hold or sell short any security (stock ETF or otherwise). We all need to think for ourselves when it comes to trading our own accounts. First, it is the only way to really learn. Second, we are the only ones responsible for our decisions. Think of these charts as food for further analysis. Before making a trade, it is important to have a plan. Plan the trade and trade the plan. Among other things, this includes setting a trigger level, a target area and a stop-loss level. It is also important to plan for three possible price movements: advance, decline or sideways. Have a plan for all three scenarios BEFORE making the trade. Consider possible holding times. And finally, look at overall market conditions and sector/industry performance.


