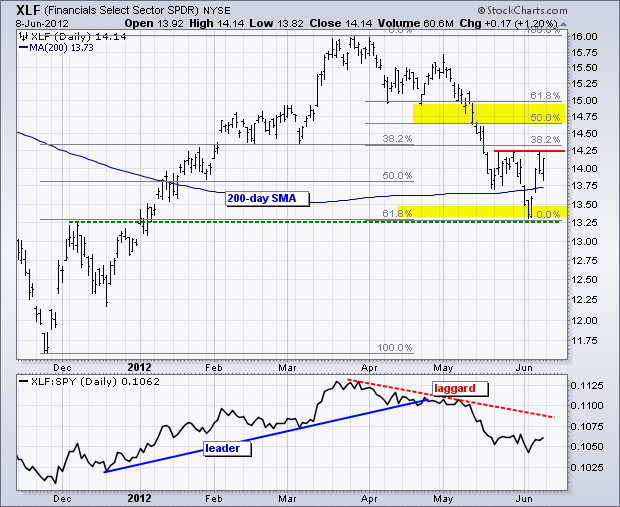
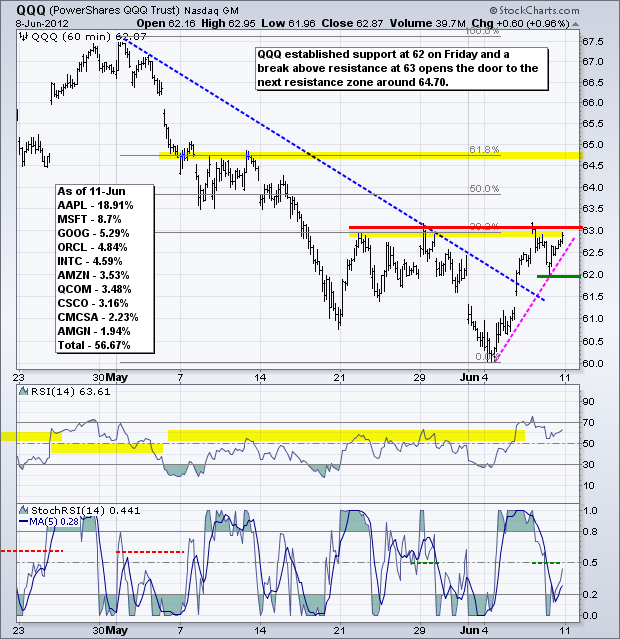
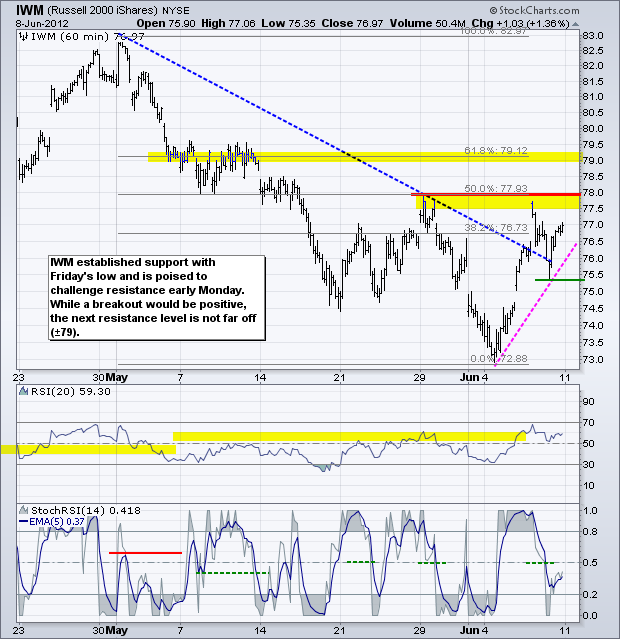
Stocks opened weak on Friday, but rallied throughout the day and closed strong. Rumors of a Spanish bailout fueled los toros (the bulls). Small-caps led the way higher with the Russell 2000 ($RUT) gaining over 1% on the day. All nine sectors were up with the Finance SPDR (XLF) and Technology SPDR (XLK) leading the charge. Both were up over 1%. Clearly, XLF stands the most to benefit from a bailout of Spanish banks. Even though direct exposure to Spain may be limited, the domino effect clearly rattled the big banks in early June. XLF bounced off 13.25 support last week and reclaimed its 200-day moving average. With another surge expected today, it will break the late May highs and could be on its way to the next resistance zone in the 14.75 area.
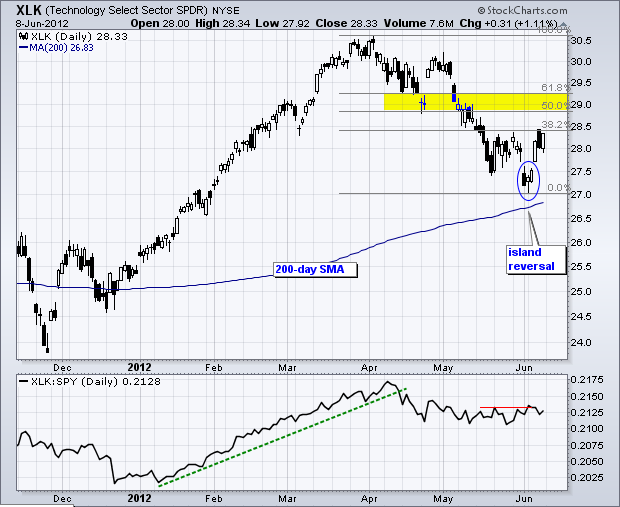
XLK held above the 200-day moving average and formed an island reversal with last week's gap. The 29 area marks the next resistance zone. As a sector, technology companies derive over 50% of their revenues from overseas.
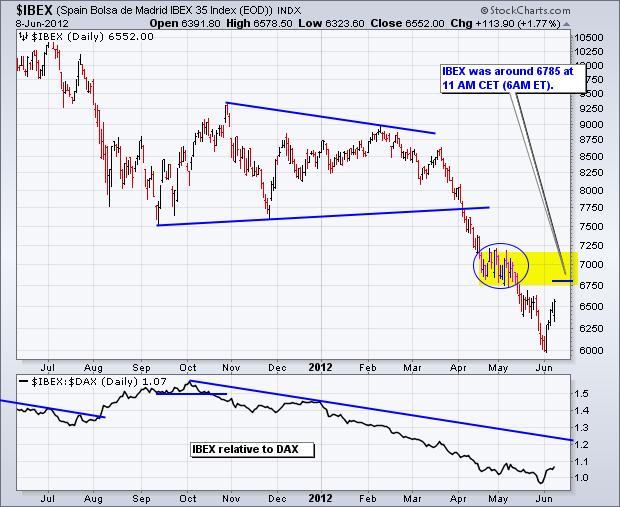
With its aid request over the weekend, Spain became the fourth country in the Eurozone to require financial assistance. Greece kicked everything off with 110 billion Euros in May 2010. Ireland followed with 67.5 billion Euros in November 2010. Portugal got a 78 billion Euro bailout in May 2011. Greece got another 130 billion Euro bailout in February 2011. Spain is next up to the tune of 100 billion Euros. In contrast to the other bailouts, the Spanish bailout has yet to be formalized. At present it is just a request that has been approved by EU finance ministers. There is no set amount, there are no details on where the money will come from and there are no details on the conditions of the bailout. In other words, there is still a lot of work to be done here. Spanish officials will provide the EU with the exact amount on or before June 21st. The Spain Bolsa de Madrid IBEX 35 Index ($IBEX) surged last week in anticipation. The index is up over 4% in early trading on Monday, but already in its first resistance zone from the prior consolidation (late April and early May).
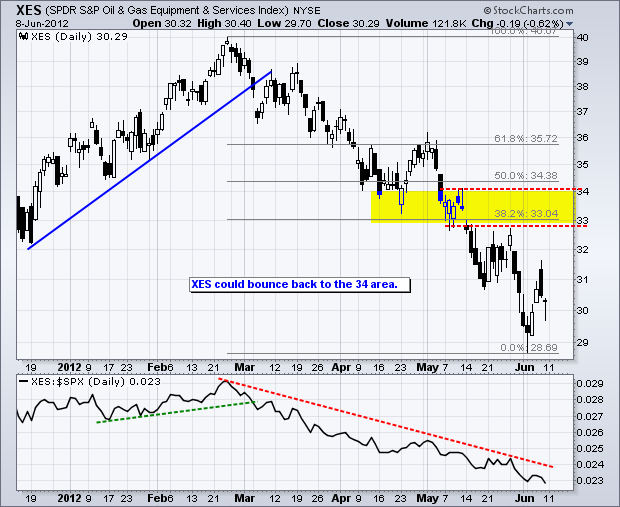
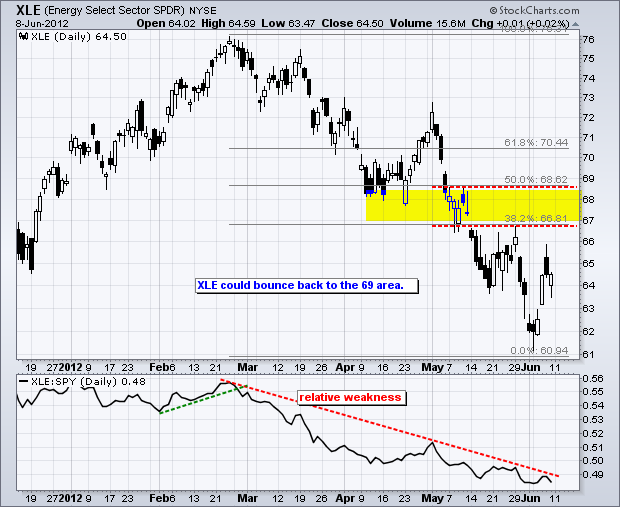
With another bailout in the works and the markets extending the risk-off bounce on Monday, oil is getting a boost and energy stocks may be poised to partake. I am also wondering about recent events in Syria and the potential for a higher risk premium in oil. Russia wants Iran involved in any talks on Syria, but the US opposes this. Meanwhile, the country is clearly heading towards civil war. Analysts suggest that Syrian is not like Lybia, which imploded. Syria has the potential to explode and further instability could undermine the entire region
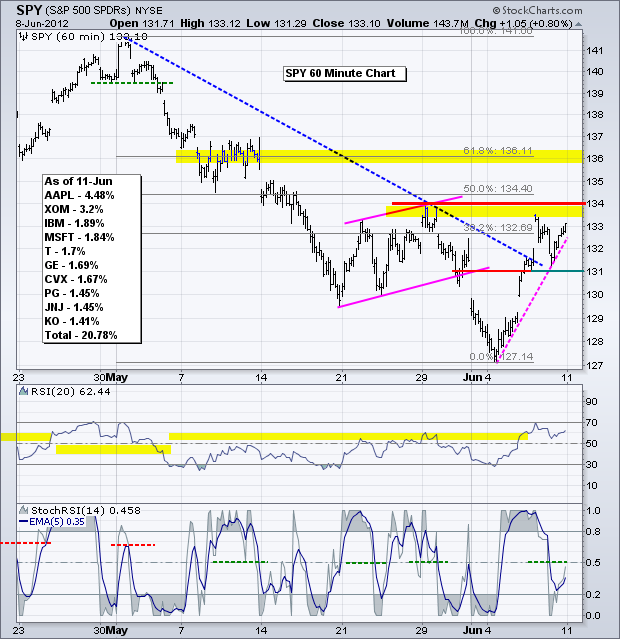
On the 60-minute chart, the S&P 500 ETF (SPY) opened weak, dipped to 131 in the first hour and then moved higher to close above 133. Stock futures are higher on Monday morning and we can expect a break above resistance at 134. This opens the door to the next resistance zone around 136. With Friday's bounce, we can now set key support at 131.
**************************************************************************
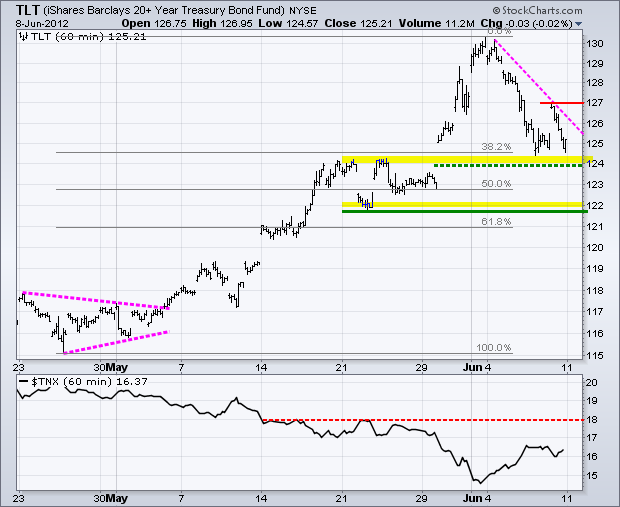
The need for a safe-haven will diminish today as the Euro and stocks bounce. The 20+ Year T-Bond ETF (TLT) surged to 127 early Friday, but immediately peaked and moved lower after the open. This coincided with an advance in stocks. Friday's high now marks resistance at 127. With further weakness expected on Monday, a test of the late May lows is now in order.
**************************************************************************
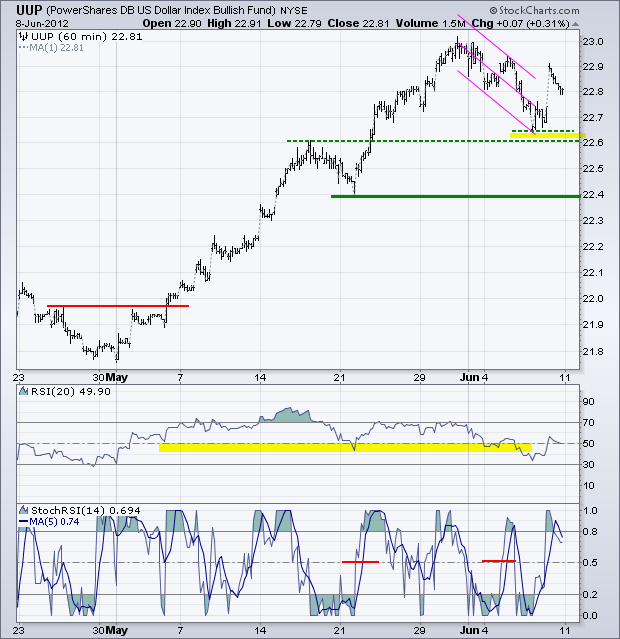
The US Dollar Fund (UUP) surged on Friday and then pulled back as stocks rallied. The Dollar is expected to open lower on Monday and this means UUP will tests support in the 22.60 area.
**************************************************************************
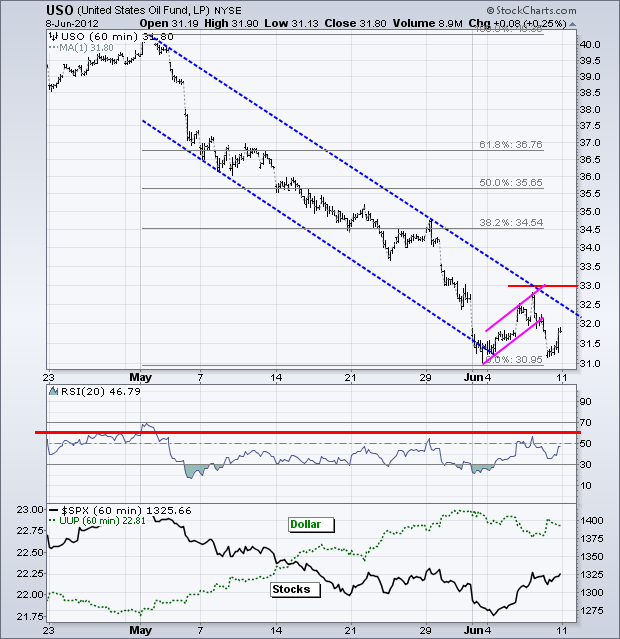
The US Oil Fund (USO) opened weak and then bounced along with the stock market and the Euro. Further strength in these two could further benefit oil. USO bounced off support and will likely challenge resistance at 33 today. A breakout would argue for an oversold bounce that would retrace a portion of the prior decline. A shallow 38.2% retracement would extend to the 34.50 area.
**************************************************************************
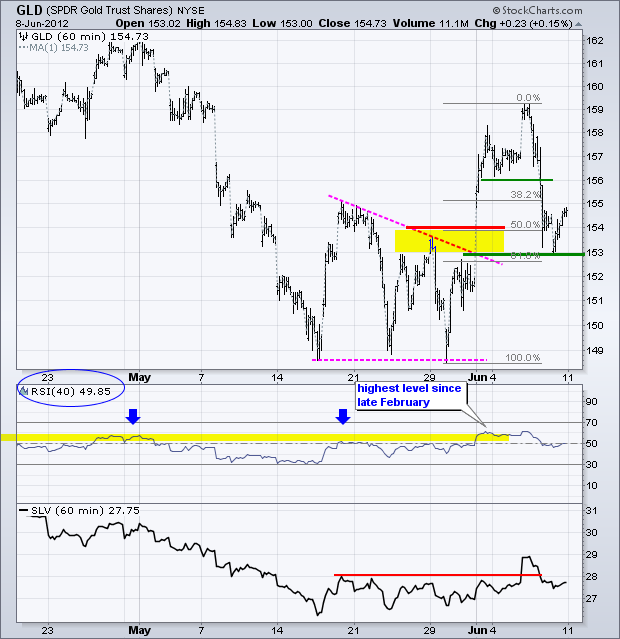
Gold futures are up in early trading on Monday. Gold appears to be benefitting from weakness in the Dollar and strength in stocks, which makes it a risk-on asset for now. The Gold SPDR (GLD) plunged back to broken resistance and then firmed. Despite a sharp move lower, the decline retraced 61.80% of the prior surge and GLD is showing signs of support. This level best hold to keep the breakout alive. A move below 153 would be negative.
**************************************************************************
Key Economic Reports:
Mon - Jun 11 - 10:00 – IMF Report on Spanish Banks
Wed - Jun 13 - 07:00 - MBA Mortgage Index
Wed - Jun 13 - 08:30 - Retail Sales
Wed - Jun 13 - 08:30 - Producer Price Index (PPI)
Wed - Jun 13 - 10:00 - Business Inventories
Wed - Jun 13 - 10:30 - Oil Inventories
Thu - Jun 14 - 08:30 - Jobless Claims
Thu - Jun 14 - 08:30 - Consumer Price Index (CPI)
Fri - Jun 15 - 08:30 - Empire Manufacturing
Fri - Jun 15 - 09:15 - Industrial Production
Fri - Jun 15 - 09:55 - Michigan Sentiment
Sun - Jun 17 - 10:00 – Greek Elections
Thu - Jun 21 - 10:00 – Amount for Spanish Bailout Request
Sun - Jun 28 - 10:00 – 2-day EU Summit
Charts of Interest: Tuesday and Thursday
This commentary and charts-of-interest are designed to stimulate thinking. This analysis is not a recommendation to buy, sell, hold or sell short any security (stock ETF or otherwise). We all need to think for ourselves when it comes to trading our own accounts. First, it is the only way to really learn. Second, we are the only ones responsible for our decisions. Think of these charts as food for further analysis. Before making a trade, it is important to have a plan. Plan the trade and trade the plan. Among other things, this includes setting a trigger level, a target area and a stop-loss level. It is also important to plan for three possible price movements: advance, decline or sideways. Have a plan for all three scenarios BEFORE making the trade. Consider possible holding times. And finally, look at overall market conditions and sector/industry performance.

