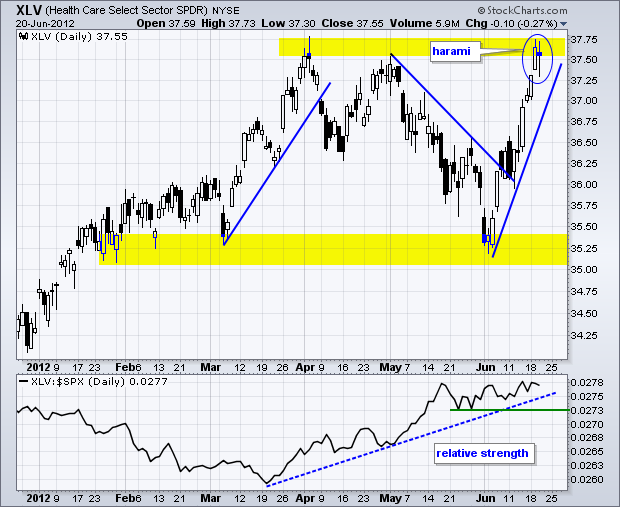
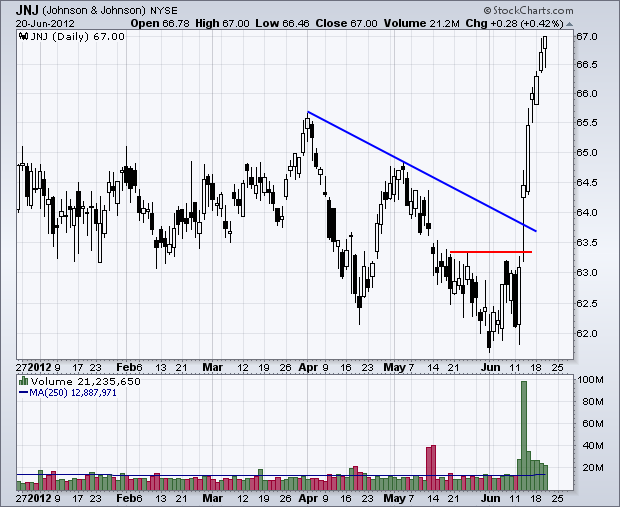
Stocks edged lower on Wednesday as the Fed failed to inspire a continuation of the current rally. Except for the Nasdaq 100 ETF (QQQ), which gained .08%, the major index ETFs closed fractionally lower. Seven of the nine sectors were down with the Industrials SPDR (XLI), Basic Materials SPDR (XLB) and Utilities SPDR (XLU) leading the way lower. The Technology SPDR (XLK) and Finance SPDR (XLF) managed small gains. The Healthcare SPDR (XLV) could be on the hot seat soon as the Supreme Court gets closer to a verdict on the healthcare law. Intrade.com is pricing in a 75% chance that the court will strike down the individual mandate with a party line vote. I am not sure how this will affect the sector as a whole, however, it would create more uncertainty and this would be negative for the sector and the market as a whole. The US spent some $2.6 trillion on healthcare in 2010 with 31% going to hospitals.
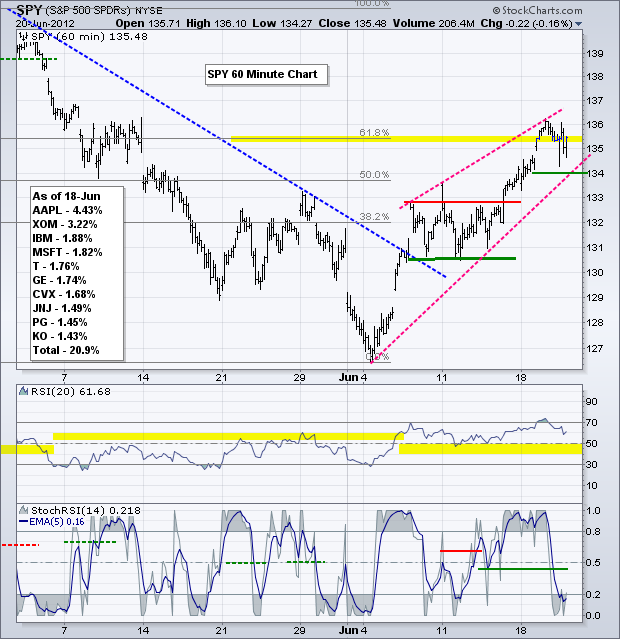
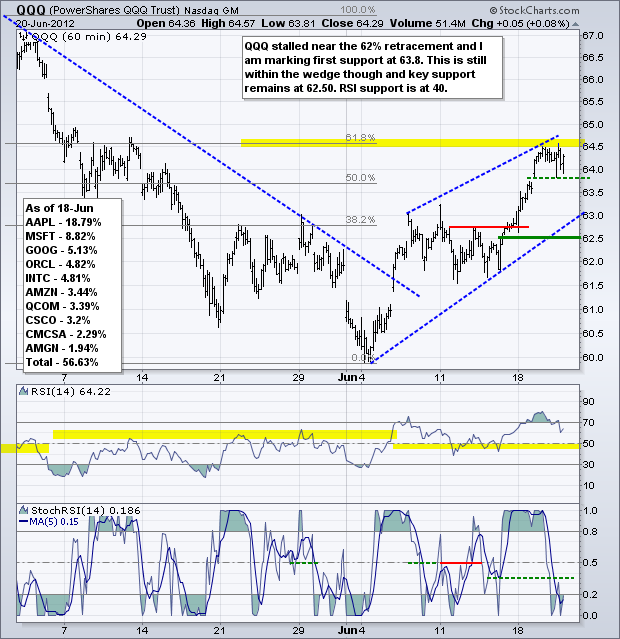
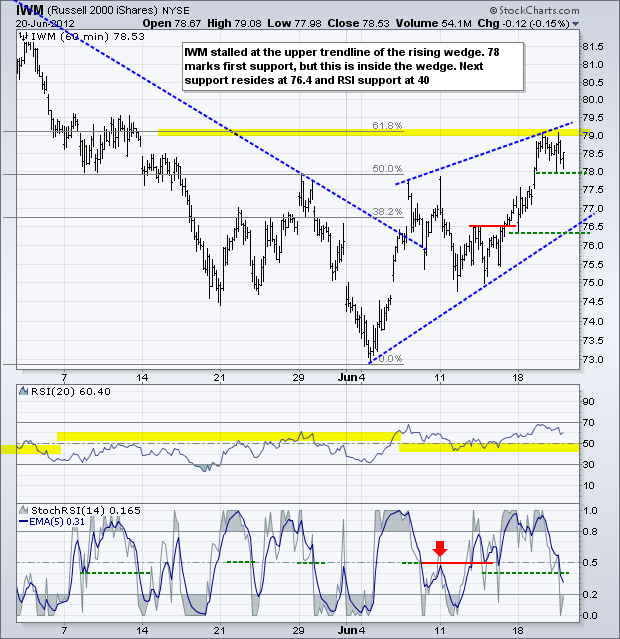
The moment-of-truth is here for the major index ETFs. After a nice June advance, IWM, QQQ and SPY retraced 61.80% of their prior declines and met some resistance on Wednesday. On the 60-minute chart, SPY formed a rising wedge and stalled in the 135-136 zone. The wedge is still rising because the lower trendline has yet to be broken. A move below 134 would break wedge support and provide the first signal for a short-term trend reversal. RSI remains in bull mode with support marked at 40. The 5-period EMA of StochRSI, however, plunged below .40 to signal a short-term shift in the momentum of momentum, which is essentially acceleration. Yes, StochRSI is a momentum indicator of RSI, which is also a momentum indicator. Normally, I look for bearish signals in StochRSI when RSI is in bear mode and the 50-60 zone is acting as resistance. The current bear signal in StochRSI occurred with RSI in bull mode because the 40-50 zone is acting as support.
**************************************************************************
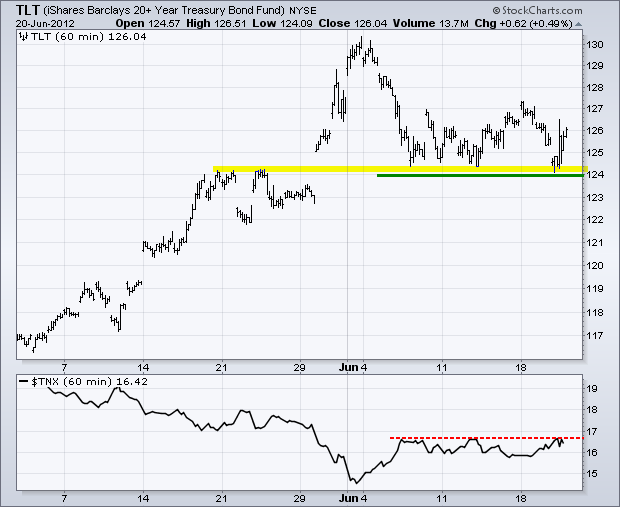
Is operation twist enough to do the trick? The Fed admitted that economic growth and employment growth were slowing, but still opted for a relatively muted response. By selling shorter maturities and buying longer maturities, the Fed hopes to push long-term rates lower. The market is not impressed. The 20+ Year T-Bond ETF (TLT) opened weak with a support test and then bounced off support with a rather strong move. This reinforces support and the big trend remains up. This means the big trend for rates is down. These trends are negative for stocks.
**************************************************************************
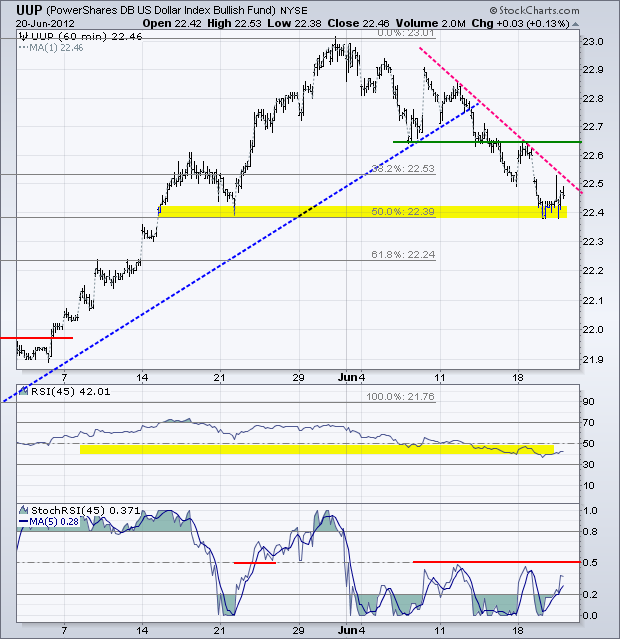
Muted quantitative easing is positive for the Dollar because it means less money floating around. The US Dollar Fund (UUP) bounced along with treasuries, but UUP remains in a downtrend this month. The pink trendline marks first resistance and Monday's high marks key resistance. I am also watching the 5-period EMA of StochRSI for signs of an upside breakout. A move above .50 would turn momentum bullish.
**************************************************************************
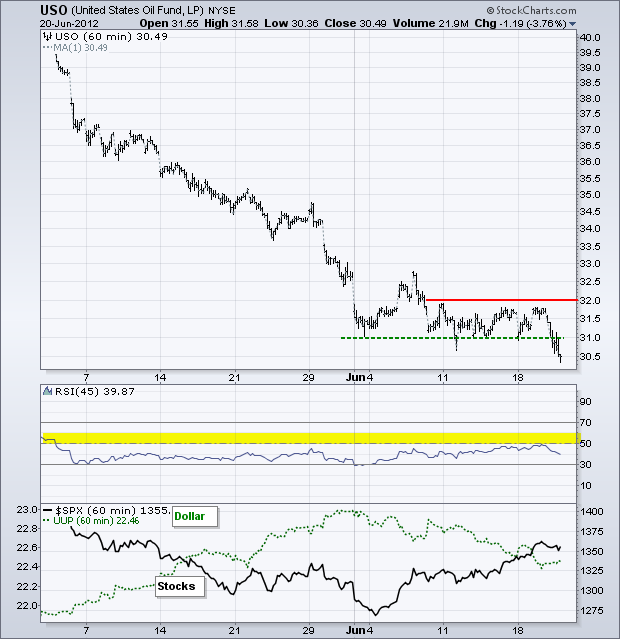
The US Oil Fund (USO) cannot hold a bid to save its life. The oil market was slammed by a report showing US inventories reaching a 22 year high. A less aggressive Fed also weighed on oil. USO broke support to signal a continuation of the downtrend. This move reinforces resistance at 32. Even though stocks and the Euro had their own risk-on party in June, oil did not partake and the risk-on trade was incomplete. Weakness in oil is negative for stocks and positive for treasuries.
**************************************************************************
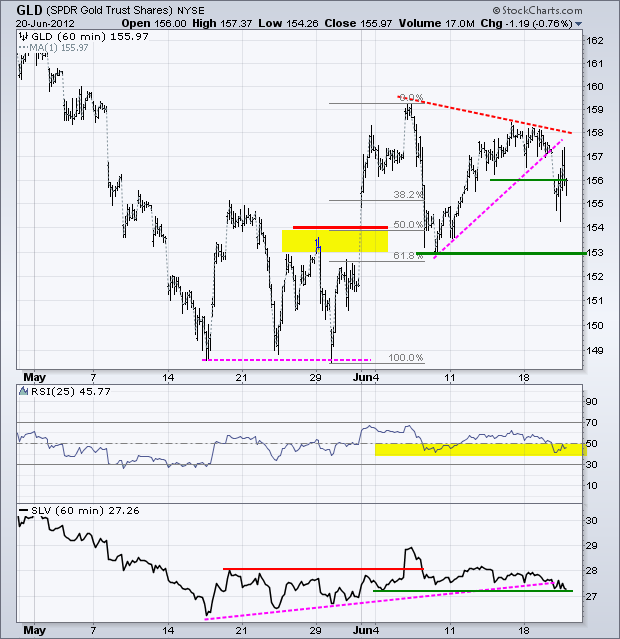
The muted Fed response also weighed on the Gold SPDR (GLD), which broke below its first support level at 156. Also notice that GLD did not exceed its early June high and follow through to this early June surge was stopped. This is a negative development and we could now see a test of the breakout at 153. Frankly, I think GLD should be above 160 by now and the inability to follow through is bearish. This increases the chances that GLD will test the May lows and the medium-term downtrend will continue. Keep in mind that GLD has been trending lower since August 2011.
**************************************************************************
Key Reports and Events:
Thu - Jun 21 - 08:30 – Supreme Court Healthcare Ruling?
Thu - Jun 21 - 08:30 - Initial Claims
Thu - Jun 21 - 10:00 - Existing Home Sales
Thu - Jun 21 - 10:00 - Philadelphia Fed
Thu - Jun 21 - 10:00 - Leading Economic Indicators
Thu - Jun 21 - 10:00 – Consultant's Report on Spanish Banks?
Fri - Jun 22 - 10:00 – Merkel, Hollande, Rajoy and Monti Meet
Mon - Jun 25 - 08:30 – Supreme Court Healthcare Ruling?
Sun - Jun 28 - 10:00 – 2-day EU Summit
Thu - Jul 25 - 10:00 – European Central Bank Policy Statement
Charts of Interest: Tuesday and Thursday
This commentary and charts-of-interest are designed to stimulate thinking. This analysis is not a recommendation to buy, sell, hold or sell short any security (stock ETF or otherwise). We all need to think for ourselves when it comes to trading our own accounts. First, it is the only way to really learn. Second, we are the only ones responsible for our decisions. Think of these charts as food for further analysis. Before making a trade, it is important to have a plan. Plan the trade and trade the plan. Among other things, this includes setting a trigger level, a target area and a stop-loss level. It is also important to plan for three possible price movements: advance, decline or sideways. Have a plan for all three scenarios BEFORE making the trade. Consider possible holding times. And finally, look at overall market conditions and sector/industry performance.

