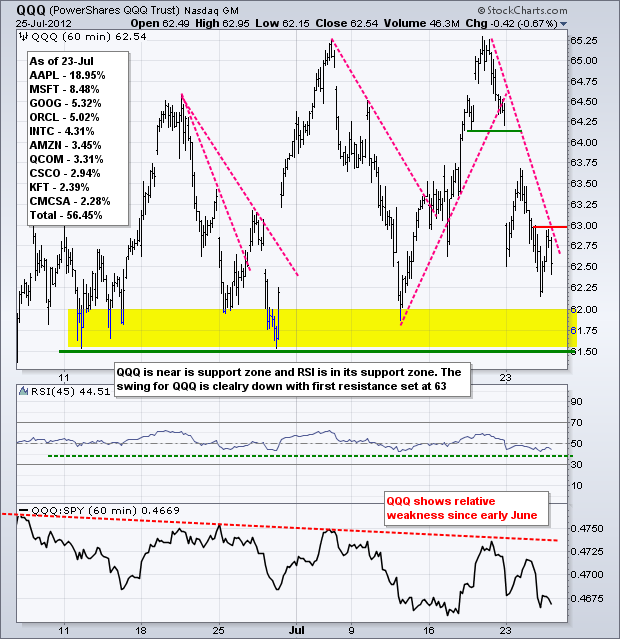
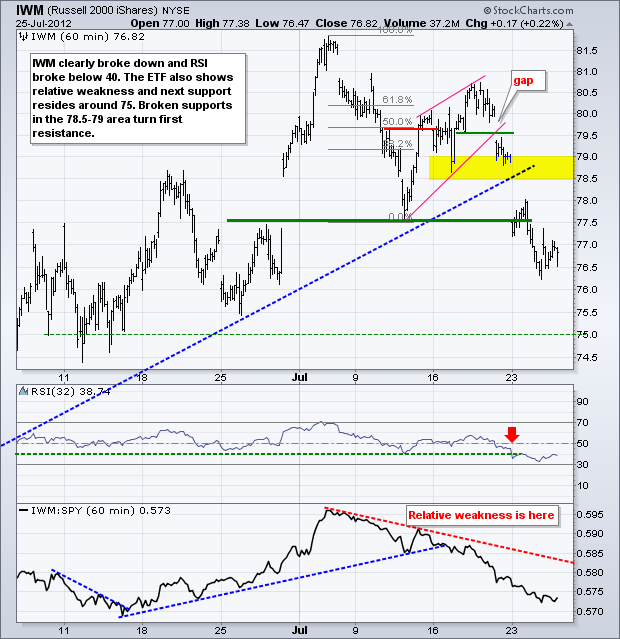
Stocks were mixed on Wednesday. The Nasdaq 100 ETF (QQQ) and S&P 100 ETF (OEF) moving lower, but the Russell 2000 ETF (IWM) and S&P MidCap 400 SPDR (MDY) edging higher. The sectors were also moved with the Consumer Discretionary SPDR (XLY) and Technology SPDR (XLK) moving lower, while the Finance SPDR (XLF) and Industrials SPDR (XLI) edged higher. It does not get more indecisive than that.
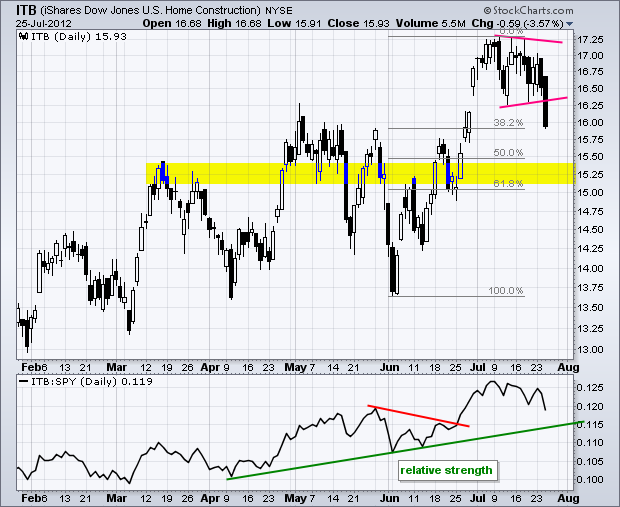
Housing stocks were the big losers as the Home Construction iShares (ITB) plunged over 3% after new home sales dipped to their lowest level since January. This is the second negative housing-related number this month because sales of existing homes fell as well. ITB had a bullish pennant working this month, but failed to breakout on the upside and plunged below first support. While the longer trend remains up, the short-term trend is down and this correction could extend further.
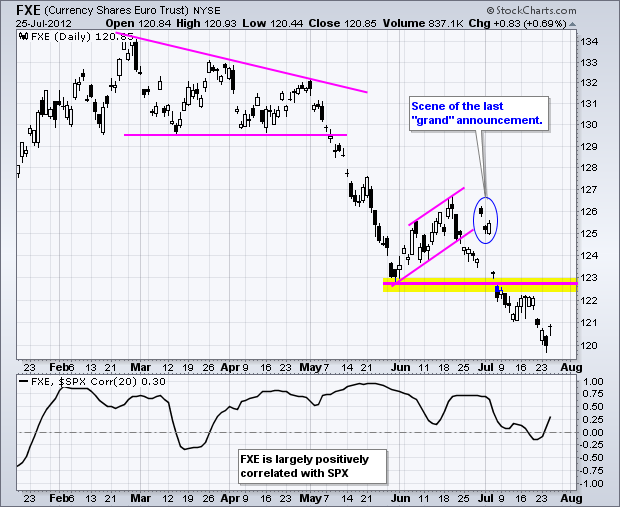
The Eurozone remains a concern as Spanish bond yields hold at high levels (> 7.5%). These levels are unsustainable because they put enormous pressure on Spain to service its debt. Have no fear because Bloomberg reports:
"The euro area is ready to act to help Spain as the country's borrowing costs soar, Luxembourg Finance Minister Luc Frieden said. While Frieden said no work is being done for a bailout of the Spanish government, policy makers in the 17-nation euro area must be prepared to move quickly."
Act already! Yes, once again, we can expect a grand announcement that may temporarily lift markets. However, investors have lost confidence in EU leaders and any bounce is likely to be temporary.
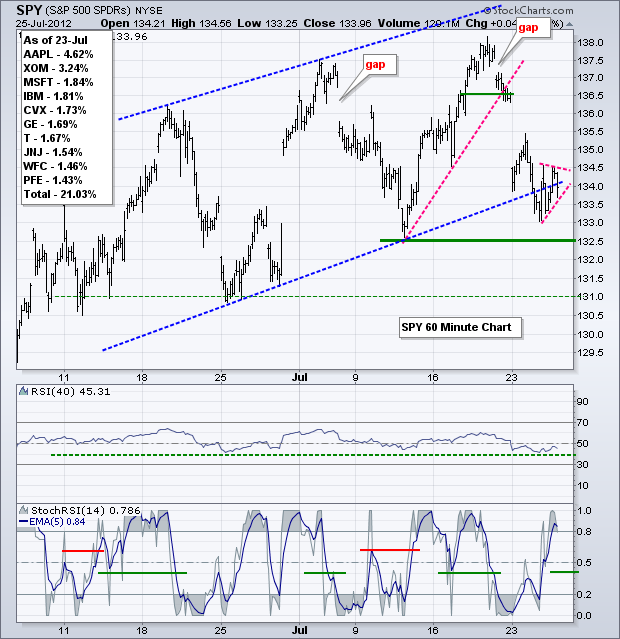
On the 60-minute chart, SPY plunged to the lower trend line of the rising channel and firmed around 134. Trading in this area has been rather choppy as the bulls and bears slug is out for control. A small pennant-like consolidation formed and a break below the lower trend line would signal a continuation lower. Support in the 131 area is the next stop. Technically, the medium-term uptrend is holding as SPY firms above the early July low and RSI holds 40. A break below both would be medium-term bearish. Chartists looking for a jump on downside momentum can watch the 5-period EMA of StochRSI. A move below .40 would be short-term bearish.
**************************************************************************
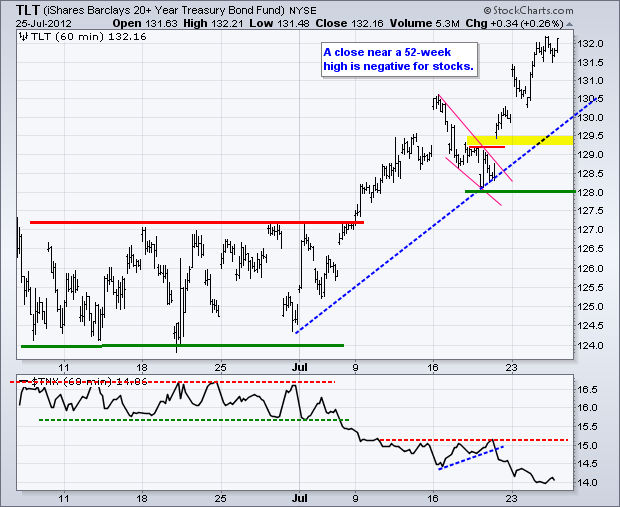
No change. The 20+ Year T-Bond ETF (TLT) took off on Friday and continued higher this week as money moved into relative safety. The 10-year Treasury Yield ($TNX) dipped below 1.4% as yields plunged. There may be no return, but there are certainly capital gains to be had as TLT advanced some 6% since late June. Broken resistance turns first support around 129.5 and key support remains at 128.
**************************************************************************
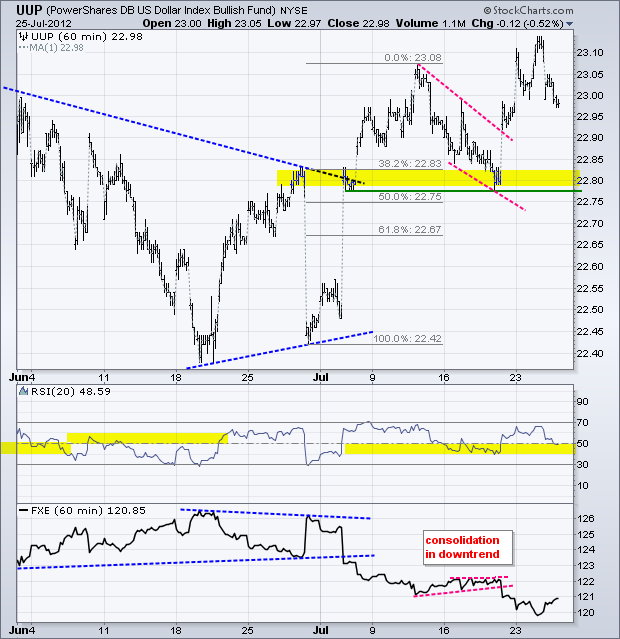
The US Dollar Fund (UUP) pulled back on Wednesday as stocks firmed and the Euro bounced. The bigger trends remain up though. The falling wedge breakout around 22.90 becomes the first support zone to watch. Key support remains at 22.80 and RSI support at 40.
**************************************************************************
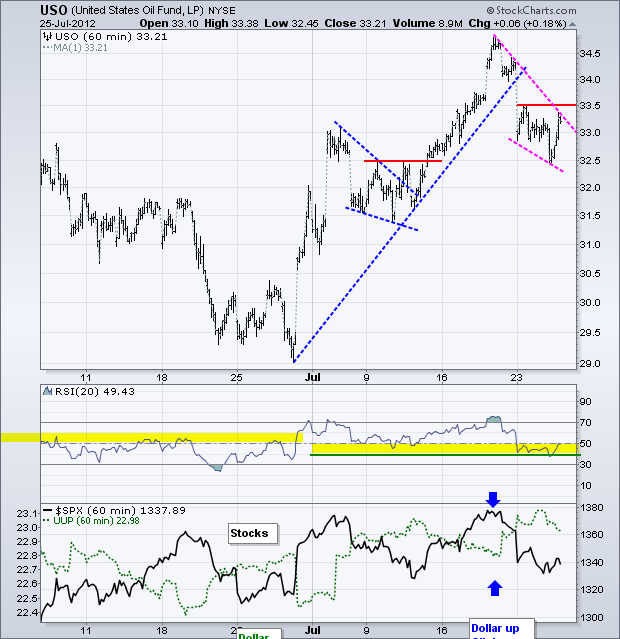
Oil remains a tough call. Events in the Middle East are keeping a bid alive, but weakness in stocks and the Euro is negative. The US Oil Fund (USO) broke down on Monday and formed a falling wedge the last few days. A break above 33.5 would be short-term bullish. Barring a breakout, we could see a move back towards the early July lows in the 31.50 area.
**************************************************************************
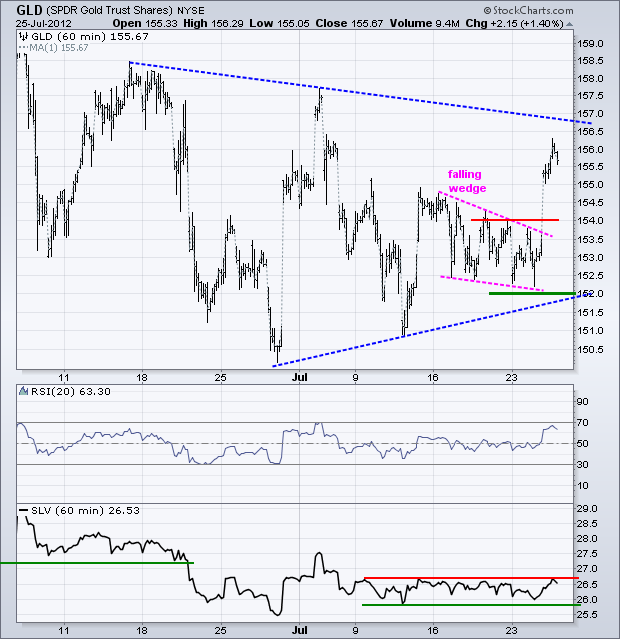
The Gold SPDR (GLD) broke above resistance with a big move on Wednesday. This is short-term bullish, but the medium-term and long-term trends remain down. Traders need to be careful because their bigger downtrends could pull trump at anytime. A triangle is also taking shape since mid June with lower highs and higher lows. Should this pattern continue, expect a peak below the early July peak.
**************************************************************************
Key Reports and Events:
Thu - Jul 26 - 08:30 - Jobless Claims
Thu - Jul 26 - 08:30 - Durable Good Orders
Thu - Jul 26 - 10:00 - Pending Home Sales
Fri - Jul 27 - 08:30 - GDP
Fri - Jul 27 - 09:55 - Michigan Sentiment
Tue - Jul 31 - 09:00 – FOMC Meeting Begins
Wed – Aug 01 - 12:30 – FOMC Policy Statement
Fri – Aug 03 - 08:30 – Employment Report
Fri – Aug 31 – 09:00 – Jackson Hole Central Bank Symposium
Charts of Interest: Tuesday and Thursday
This commentary and charts-of-interest are designed to stimulate thinking. This analysis is not a recommendation to buy, sell, hold or sell short any security (stock ETF or otherwise). We all need to think for ourselves when it comes to trading our own accounts. First, it is the only way to really learn. Second, we are the only ones responsible for our decisions. Think of these charts as food for further analysis. Before making a trade, it is important to have a plan. Plan the trade and trade the plan. Among other things, this includes setting a trigger level, a target area and a stop-loss level. It is also important to plan for three possible price movements: advance, decline or sideways. Have a plan for all three scenarios BEFORE making the trade. Consider possible holding times. And finally, look at overall market conditions and sector/industry performance.

