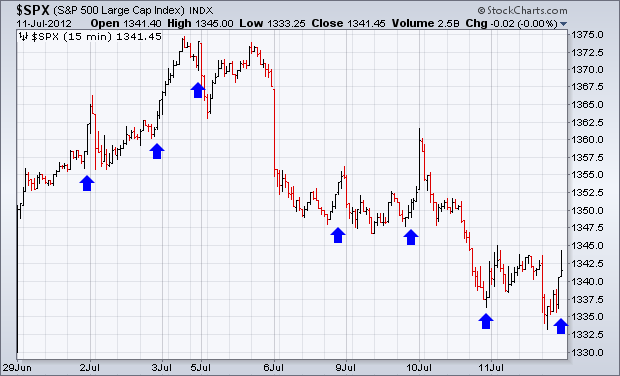
Look out below! Asian stocks are getting hammered with the Nikkei down around 1.5% and the Hang Seng down around 2%. European stocks are down modestly. US stocks were weak yesterday and even dipped after the Fed minutes, but another one of those mysterious buying surges pushed stocks off their lows in the final 30 minutes. I count seven late buying surges in the last eight days. What the ...? I am not sure where these come from, but it may be ETF managers squaring their positions at the end of the day.
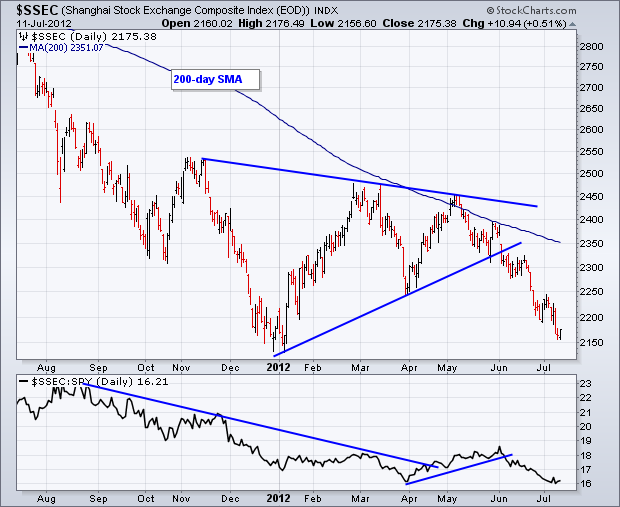
Even though central banks around the world are providing liquidity and there is still hope for QE3 from the Fed, it is clear that economies around the world are softening. The biggest risk for the bears is some sort of announcement favoring QE3. While this might not affect the long-term trend, it could trigger a sharp rally. The next FOMC meeting is August 1st, just before the jobs report on August 4th. Turning back to Asia, the chart below shows the Shanghai Composite ($SSEC) testing its December-January lows and showing relative weakness.
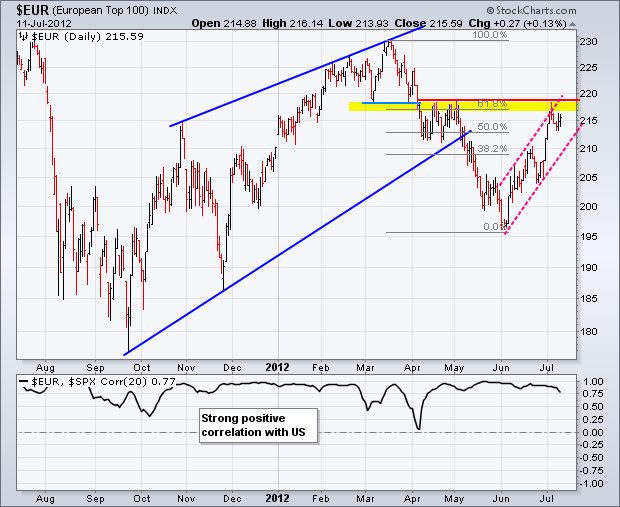
The European Top 100 Index ($EUR) surged to 215 after the EU summit, but is trading in a resistance zone with a rising channel taking shape. Notice how $EUR is at resistance from broken support and the 61.80% retracement. The EU summit may have prevented a catastrophe, but it did nothing to address economic growth, which continues to slip in the Eurozone.
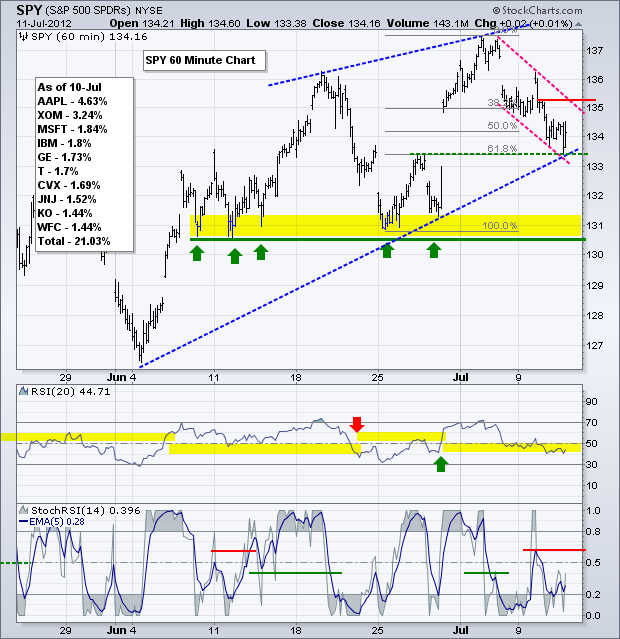
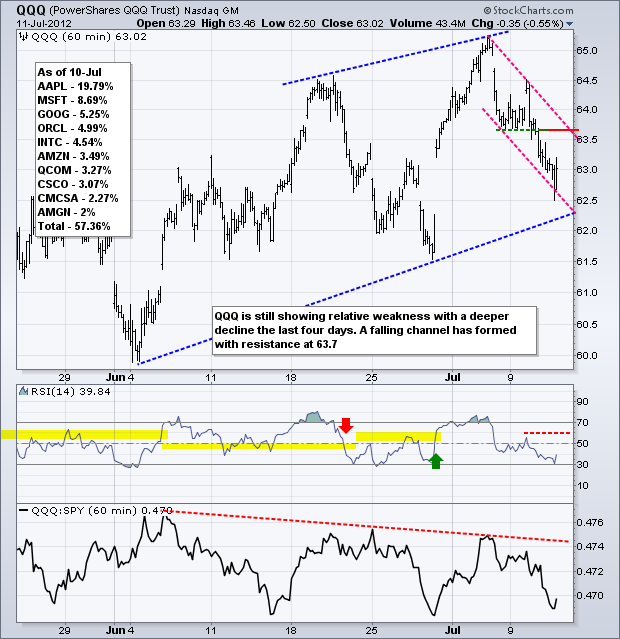
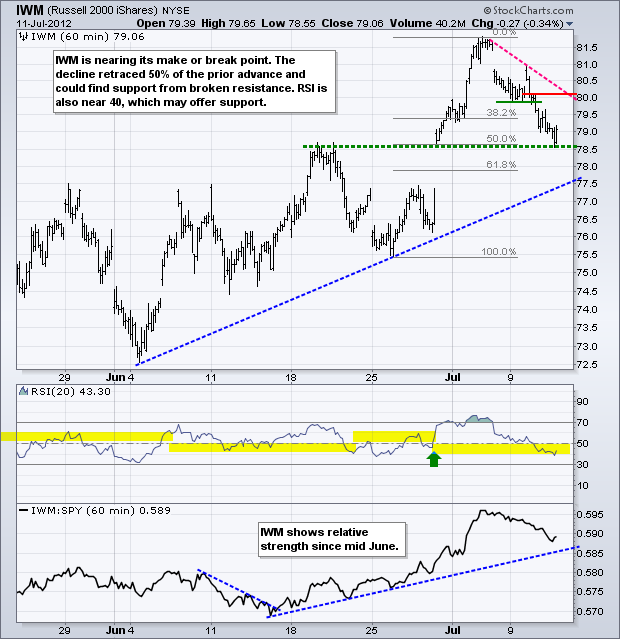
Meanwhile, back at the ranch, the US economy and earnings are dominating the trading landscape. Today, we will get an employment preview with jobless claims. The S&P 500 ETF (SPY) and the Russell 2000 ETF (IWM) are trading at potential support levels, which could mark the make-or-break point for the medium-term uptrends. There are two trends visible on the SPY chart. First, the rising wedge marks a six-week uptrend. Second, the falling channel marks a five-day downtrend. Notice that this downtrend retraced 61.80% and returned to broken resistance from last week's high (133.4). Also notice that the lower trendline of the rising wedge marks support here. A successful hold and break above 135.4 would reverse this five-day downtrend, but a support break would extend the downtrend and increase the chances of a medium-term trend reversal. RSI is battling support at 40 (medium-term trend) and .60 marks short-term momentum resistance for the 5-period EMA of StochRSI.
**************************************************************************
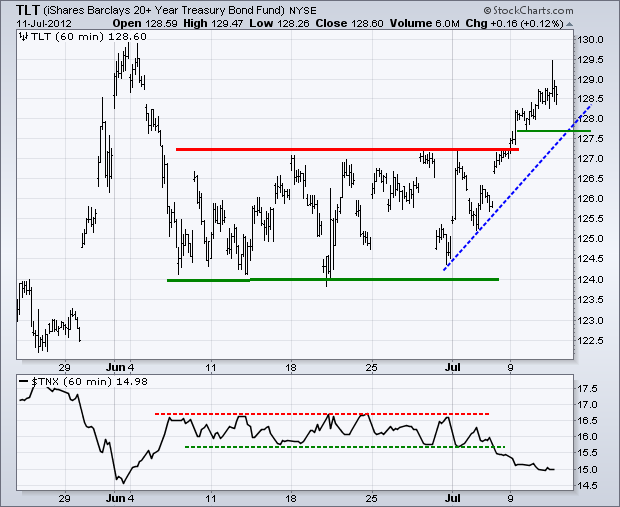
No change. Even though US treasury bonds are clearly not undervalued and offer little yield, they continue to attract safe-haven buyers as Spanish bonds yields rise and the US economy stumbles. The 20+ Year T-Bond ETF (TLT) broke resistance with a surge above 128. The bigger trend was always up and this breakout turns the short-term trend bullish again. Also notice that the 10-year Treasury Yield ($TNX) broke support with a move lower last week. Strength in treasuries is negative for US stocks.
**************************************************************************
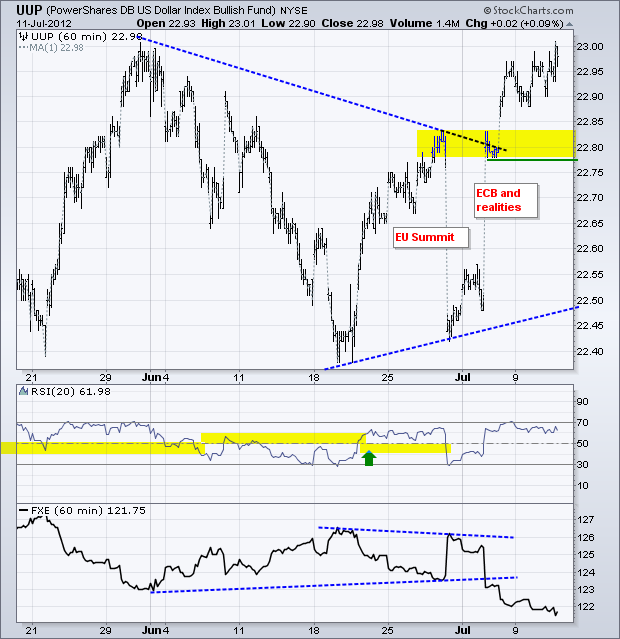
The US Dollar Fund (UUP) broke triangle resistance with a big surge and this breakout is holding. The Euro Currency Trust (FXE) broke triangle support at the same time. Broken resistance turns into the first significant support zone around 22.80. Strength in the Dollar suggests a flight-to-safety mentality (risk-off) and this is negative for stocks, oil and gold.
**************************************************************************
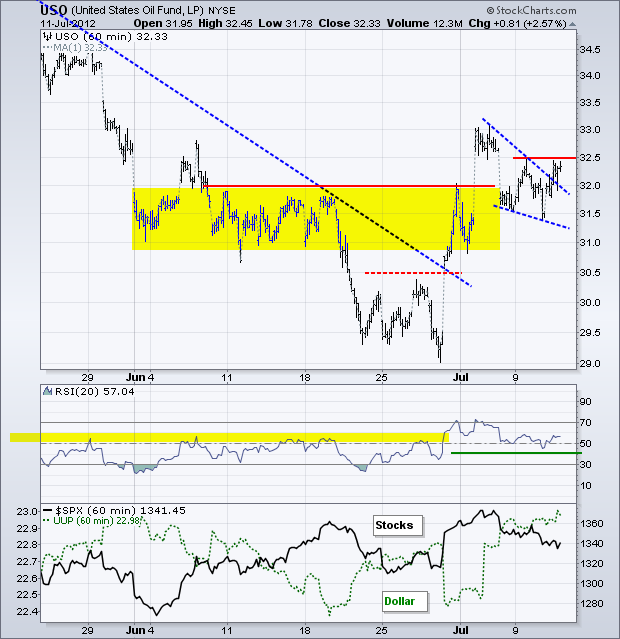
The US Oil Fund (USO) surged above falling wedge resistance with a positive reaction to US oil inventories. Despite this little breakout, I am not sure oil will hold its gains if stocks and the Euro continue to weaken. Moreover, notice that USO did not break above first resistance at 32.50. I would like to see follow through before taking yesterday's surge seriously.
**************************************************************************
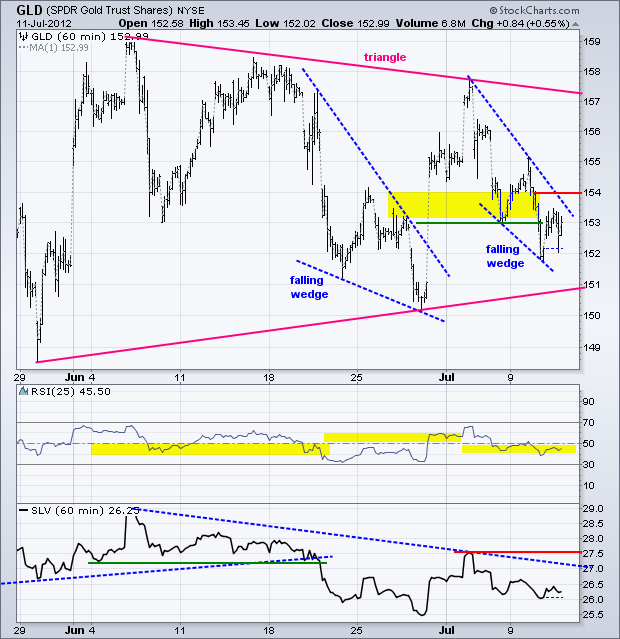
No change. Gold remains one whippy trade these days as the Gold SPDR (GLD) forms a large triangle over the last six weeks. The last two downswings formed falling wedge patterns. GLD formed a lower high after the prior breakout and the current wedge is approaching support from the late June low. Also note that GLD failed to hold the late May surge to 159 and the late June surge above 157. Even though there is a lot of support in the 150-151 area, the series of lower highs since early June shows underlying weakness. Also keep in mind that the trend since August is down.
**************************************************************************
Key Reports and Events:
Thu - Jul 12 - 08:30 - Initial Jobless Claims
Fri - Jul 13 - 08:30 - Producer Price Index (PPI)
Fri - Jul 13 - 09:55 - Michigan Sentiment
Charts of Interest: Tuesday and Thursday
This commentary and charts-of-interest are designed to stimulate thinking. This analysis is not a recommendation to buy, sell, hold or sell short any security (stock ETF or otherwise). We all need to think for ourselves when it comes to trading our own accounts. First, it is the only way to really learn. Second, we are the only ones responsible for our decisions. Think of these charts as food for further analysis. Before making a trade, it is important to have a plan. Plan the trade and trade the plan. Among other things, this includes setting a trigger level, a target area and a stop-loss level. It is also important to plan for three possible price movements: advance, decline or sideways. Have a plan for all three scenarios BEFORE making the trade. Consider possible holding times. And finally, look at overall market conditions and sector/industry performance.

About the author:
Arthur Hill, CMT, is the Chief Technical Strategist at TrendInvestorPro.com. Focusing predominantly on US equities and ETFs, his systematic approach of identifying trend, finding signals within the trend, and setting key price levels has made him an esteemed market technician. Arthur has written articles for numerous financial publications including Barrons and Stocks & Commodities Magazine. In addition to his Chartered Market Technician (CMT) designation, he holds an MBA from the Cass Business School at City University in London.
Learn More
